Obesity Rate Lowest in Hawaii, Highest in Mississippi
Reposted with permission from Gallup
STORY HIGHLIGHTS
- Nationally, obesity rate rises to 27.7% in 2014
- Obesity rates highest in Southern and Midwestern states
- Higher obesity rates linked to lower well-being
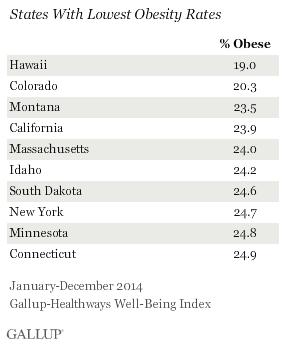
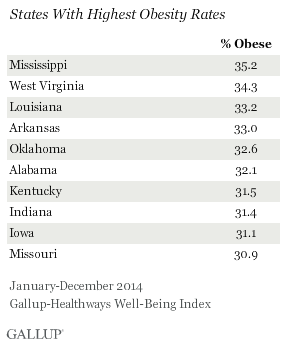
WASHINGTON, D.C. — Hawaii residents were the least likely to be obese in 2014, and Hawaii was the only state where fewer than one in five residents are obese. Mississippi had the highest obesity rate in the nation for the second year in a row, at 35.2%.
Mississippi and West Virginia have had the two highest obesity rates in the nation since 2012. Five states on the list have had consistently high obesity rates — Mississippi, West Virginia, Louisiana, Arkansas and Kentucky. These states have been among the 10 states with the highest obesity rates every year since Gallup and Healthways began tracking obesity in 2008.
On the other end of the scale, Colorado has consistently had one of the two lowest obesity rates each year since 2008. In addition to Colorado, three states — California, Massachusetts and Connecticut — have been among the 10 states with the lowest obesity rates since 2008.
The national obesity rate continued to rise in 2014 to 27.7%, up from 27.1% in 2013 and significantly higher than the 25.5% recorded in 2008. Since 2013, four states — Nevada, New Mexico, Alabama and Minnesota — have had statistically significant increases in obesity, while only one state, Tennessee, has had a statistically significant decline in obesity.
These data, collected as part of the Gallup-Healthways Well-Being Index, are based on respondents’ self-reported height and weight, which are used to calculate Body Mass Index (BMI) scores. Americans who have a body mass index of 30 or higher are classified as obese.
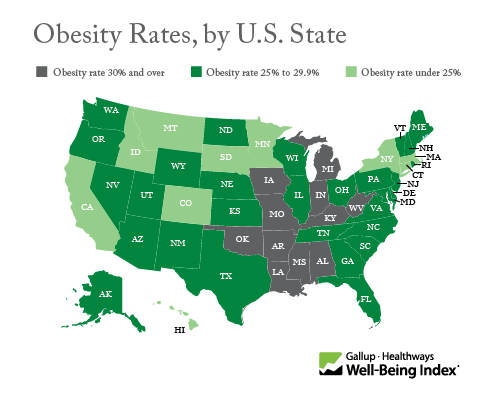
Obesity rates continue to be highest in Southern and Midwestern states and lowest in Western and Northeastern states, a pattern that has persisted since Gallup and Healthways began tracking the obesity rate in 2008.
Higher Obesity Rates Linked to Lower Well-Being
Gallup and Healthways have found a consistent and strong link between obesity and Americans’ overall well-being. Therefore, many of the states with the lowest obesity rates are also among those with the highest overall Well-Being Index scores.
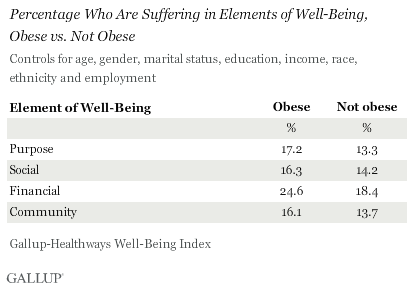
Gallup and Healthways define well-being through the five essential elements: purpose, social, financial, community and physical. For each element, respondents are sorted into one of three categories based on their level of well-being: thriving, struggling or suffering. Previous research has demonstrated a link between obesity and lower social well-being, but (excluding physical well-being, of which it is a part) obesity also has a deleterious effect on the other three elements of well-being. Across all elements of well-being, Americans who are obese are more likely to be suffering than those who are not obese.
After controlling for other factors linked to obesity — age, gender, marital status, education, income, race, ethnicity and employment — adults who are obese are:
- 29.3% more likely to be suffering in purpose well-being than those who are not obese
- 14.8% more likely to be suffering in social well-being than those who are not obese
- 33.7% more likely to be suffering in financial well-being than those who are not obese
- 17.5% more likely to be suffering in community well-being than those who are not obese
Bottom Line
The national obesity rate in 2014 was the highest that Gallup and Healthways have measured since starting to track this measure in 2008. In a handful of states, more than a third of the population is obese. Residents in these areas are less likely to eat healthily and exercise, and are more likely to suffer from chronic diseases like high blood pressure, high cholesterol, depression, diabetes, cancer and heart attacks. Obesity-related health problems could drive up healthcare costs and potentially have larger economic implications for states that suffer most.
The strong relationship between obesity and overall well-being suggests that interventions geared toward encouraging exercise and healthy eating, while important, may not be enough to reverse the upward trend in obesity. Gallup has found that Americans’ desire to lose weight is not matched by their efforts. The mismatch between desired weight loss and weight loss efforts may stem from deficits in other areas of well-being. For instance, if residents don’t have a strong sense of purpose, struggle financially or lack supportive relationships, it will be much more difficult for them to buy healthy food, exercise regularly and achieve their weight loss goals.
“There are proven, effective interventions for helping people lose weight and sustain their weight loss,” says Janet Calhoun, senior vice president at Healthways. “For maximum impact, interventions need to go beyond addressing eating habits and physical activity, and include the emotional and social aspects of well-being. Helping people approach change with optimism, resilience and with an awareness of their personal passions are proven techniques for long-lasting behavior change.”
Accordingly, members of the medical community, policymakers, employers and others working to combat obesity should seek interventions that address residents’ sense of purpose, relationships with their communities, financial health and social networks.
Read the full report on obesity by U.S. state.
SURVEY METHODS
Results are based on telephone interviews conducted as part of the Gallup-Sharecare Well-Being Index survey Jan. 2-Dec. 30, 2014, with a random sample of 176,702 adults, aged 18 and older, living in all 50 U.S. states and the District of Columbia.
The margin of sampling error for most states is ±1 to ±2 percentage points, but is as high as ±4 points for states with smaller populations, such as Wyoming, North Dakota, South Dakota, Delaware and Hawaii.
Interviews are conducted with respondents on landline telephones and cellular phones, with interviews conducted in Spanish for respondents who are primarily Spanish-speaking. Each sample of national adults includes a minimum quota of 50% cellphone respondents and 50% landline respondents, with additional minimum quotas by time zone within region. Landline and cellular telephone numbers are selected using random-digit-dial methods. Landline respondents are chosen at random within each household on the basis of which member had the most recent birthday.
Samples are weighted to correct for unequal selection probability, nonresponse, and double coverage of landline and cell users in the two sampling frames. They are also weighted to match the national demographics of gender, age, race, Hispanic ethnicity, education, region, population density and phone status (cellphone only/landline only/both, and cellphone mostly). Demographic weighting targets are based on the most recent Current Population Survey figures for the aged 18 and older U.S. population. Phone status targets are based on the most recent National Health Interview Survey. Population density targets are based on the most recent U.S. census. All reported margins of sampling error include the computed design effects for weighting.
In addition to sampling error, question wording and practical difficulties in conducting surveys can introduce error or bias into the findings of public opinion polls.
Learn more about how the Gallup-Sharecare Well-Being Index works.


