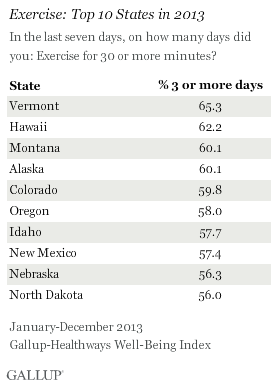
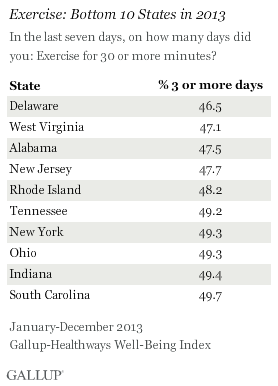
WASHINGTON, D.C. — Adults living in Vermont (65.3%) are the most likely in the U.S. to report exercising three or more days a week for at least 30 minutes. Hawaii is in second place (62.2%), while Montana and Alaska follow closely behind (60.1% each). Residents of Delaware, West Virginia, and Alabama are the least likely to report that they exercise frequently.

Six states, Vermont, Hawaii, Montana, Alaska, Colorado, and New Mexico, have ranked among the top 10 states for frequent exercise every year since Gallup and Sharecare began tracking Americans’ exercise habits in 2008. Vermont has taken the top spot three times, in 2013, 2009, and 2008, while Alaska was ranked first in both 2012 and 2010. On the other hand, four states — Indiana, Ohio, New Jersey, and Alabama — have ranked in the bottom 10 every year since 2008.
The national average for regular exercise decreased slightly to 51.6% in 2013 from 52.7% in 2012, but remains in line with the averages reported in previous years. According to NOAA’s National Climatic Data Center, 2013 brought the coldest and wettest weather on record since 2009. This contrasts with 2012, which was the warmest year on record and considerably drier than 2013 was. These changes in weather may be related to Americans’ exercising less frequently in 2013 than in 2012. Frequent exercise declined at least marginally in 31 states in 2013 compared with 2012, while it increased in 19 states.The results are from the Gallup-Sharecare Well-Being Index from January through December 2013, and are based on interviews with more than 178,000 U.S. adults, with each state’s data weighted to match U.S. Census demographic parameters for that state’s adult population. The state sample sizes range from 547 for North Dakota to 17,053 for California. All have at least 500 respondents and 40 states have at least 1,000.
The incidence of frequent exercise in a state is a function of many factors, including the age of the population, the availability of outdoor activities, and state-specific cultural factors that help determine the most popular recreational or leisure time activities. Additionally, many Americans are physically active as part of their work, and state-by-state differences in the type of work that residents do could affect the averages.
Vermont Residents Remain Most Likely to Eat Produce, Oklahomans the Least
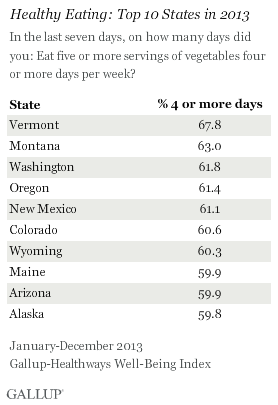
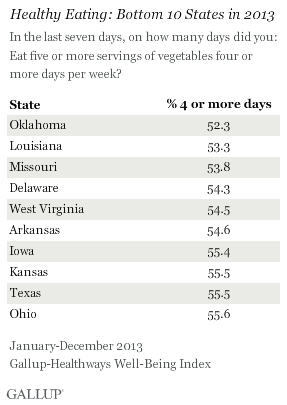
For the second year in a row, Vermont residents are the most likely to report consuming produce frequently, with 67.8% of residents reporting that they eat at least five servings of vegetables four or more days per week. Montana (63.0%) and Washington (61.8%) residents follow closely behind. Oklahoma, Louisiana, and Missouri residents are the least likely to report consuming produce frequently.

Vermont, Oregon, and Maine have ranked in the top 10 for frequent produce consumption every year since Gallup and Sharecare started tracking Americans’ produce consumption in 2008. While no state has ranked within the bottom 10 every year since 2008, seven states — Texas, Iowa, Arkansas, Louisiana, Oklahoma, Nebraska, and North Dakota — have been in the bottom 10 for five out of six years.
The nationwide average for regular produce consumption was 57.7% in 2013. The estimate has been highly stable since Gallup began tracking it in 2008, ranging narrowly between 56.0% and 57.8%.
Implications
With obesity rates rising in almost every state in 2013, it is important that state and local leaders address the decrease in exercise in 2013 and the unchanged level of regular produce consumption.
“There are tangible policies that cities and states can adopt to create an environment where the healthy choice is the easy choice — environments where fruits and vegetables are abundant and easy to access and people can easily exercise and move naturally in their communities,” said Dan Buettner, National Geographic Fellow and Founder, Blue Zones, LLC. “When leadership makes it a priority to bring in policies that promote an environment of healthy choices, then it’s not surprising that better outcomes ensue.”
There are six states that rank in the top 10 for both frequent exercise and regular produce consumption, and five of them — Montana, Colorado, New Mexico, Vermont, and Oregon — also ranked in the bottom one-third in state obesity rates. While obesity is a complex condition, state and local policies and programs that encourage frequent exercise and healthy eating can reduce state and national obesity rates.
Gallup’s “State of the States” series reveals state-by-state differences on political, economic, and well-being measures Gallup tracks each day. New stories based on full-year 2013 data will be released in the coming months.
SURVEY METHODS
Results are based on telephone interviews conducted as part of the Gallup-Sharecare Well-Being Index survey Jan. 2-Dec. 29, 2013, with a random sample of 178,072 adults, aged 18 and older, living in all 50 U.S. states and the District of Columbia.
The margin of sampling error for most states is ±1 to ±2 percentage points, but is as high as ±4 points for states with smaller populations, such as Wyoming, North Dakota, South Dakota, Delaware, and Hawaii.
Interviews are conducted with respondents on landline telephones and cellular phones, with interviews conducted in Spanish for respondents who are primarily Spanish-speaking. Each sample of national adults includes a minimum quota of 50% cellphone respondents and 50% landline respondents, with additional minimum quotas by time zone within region. Landline and cellular telephone numbers are selected using random-digit-dial methods. Landline respondents are chosen at random within each household on the basis of which member had the most recent birthday.
Samples are weighted to correct for unequal selection probability, nonresponse, and double coverage of landline and cell users in the two sampling frames. They are also weighted to match the national demographics of gender, age, race, Hispanic ethnicity, education, region, population density, and phone status (cellphone only/landline only/both, and cellphone mostly). Demographic weighting targets are based on the most recent Current Population Survey figures for the aged 18 and older U.S. population. Phone status targets are based on the most recent National Health Interview Survey. Population density targets are based on the most recent U.S. census. All reported margins of sampling error include the computed design effects for weighting.
In addition to sampling error, question wording and practical difficulties in conducting surveys can introduce error or bias into the findings of public opinion polls.
For more details on Gallup’s polling methodology, visit www.gallup.com.

