STORY HIGHLIGHTS
- 11.3% of U.S. adults are without health insurance in the first quarter of 2017
- Uninsured rate up slightly from 10.9% in the third and fourth quarters of 2016
- Percentage uninsured has dropped sharply among young adults since 2013
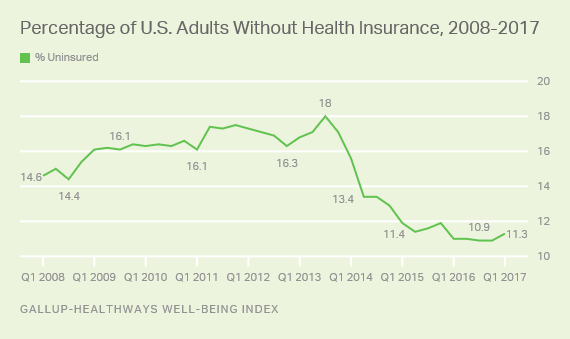
WASHINGTON, D.C. — The percentage of U.S. adults without health insurance rose slightly in the first quarter of 2017, to 11.3%. The uninsured rate was 10.9% in each of the last two quarters of 2016, a record low since Gallup and Sharecare began tracking insurance coverage in 2008.
Despite an uptick in the uninsured rate in the first quarter of 2017, the number of U.S. adults without health insurance is still 6.7 percentage points lower than it was at its peak in the third quarter of 2013. The uninsured rate reached 18.0% that quarter, just before the health insurance exchanges opened in October 2013. Beginning in 2014, the Affordable Care Act’s individual mandate required Americans to obtain coverage or pay a tax penalty.
The results for the first quarter of 2017 are based on 44,596 interviews with U.S. adults aged 18 and older from Jan. 2 to March 31, conducted as part of the Gallup-Sharecare Well-Being Index. Gallup and Sharecare have asked a random sample of at least 500 U.S. adults each day since January 2008 whether they have health insurance.
Health Insurance Coverage Up Among Key Demographic Groups
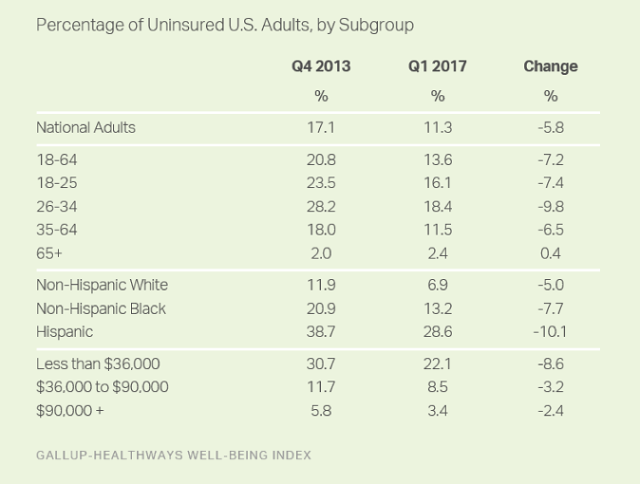
Young adults have seen some of the most significant decreases in uninsured rates since the requirement to obtain health insurance coverage took effect. Adults aged 18 to 25 have seen more than a seven-percentage-point decline in their uninsured rate — which may be, in part, attributable to an ACA provision that allows young adults to remain on their parents’ health insurance until age 26. Meanwhile, those aged 26 to 34 have seen a nearly 10-point drop.
Young adults represent a critical group in a well-functioning healthcare market, since their premiums help offset the higher costs of older Americans who typically use more medical services.
Uninsured rates also have fallen substantially among Hispanics and lower-income Americans — the two groups with the highest uninsured rates before the mandate to carry insurance took effect. Although the uninsured rate among Hispanics remains the highest of any major racial or ethnic group, at 28.6%, it is down 10.1 points since the last quarter of 2013.
By comparison, the uninsured rates for non-Hispanic black and white adults have fallen by nearly eight and five points, respectively. The rate among lower-income adults has dropped nearly nine points, far outpacing that of middle-income (down 3.2 points) and high-income adults (down 2.4 points).
Self-Paid Plans, Medicaid Show Largest Growth in Plan Type
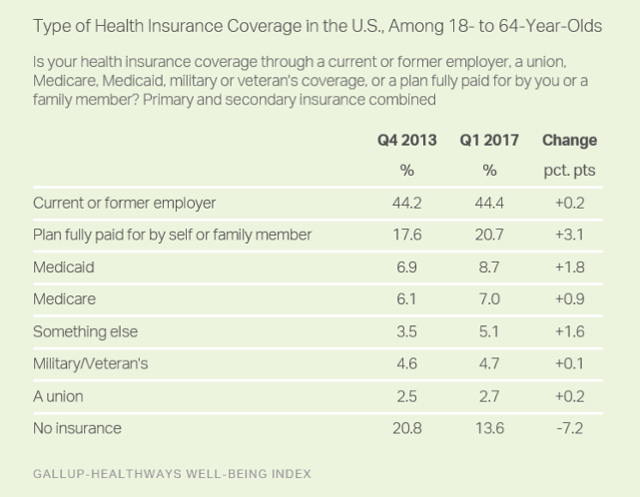
Because most Americans aged 65 and older receive health coverage through Medicare, Gallup and Sharecare assess changes in insurance sources among adults aged 18 to 64. Since the individual mandate took effect, the largest change in plan type or source of insurance has been among adults who fully pay for their own plans. This group has grown by just over three points since the last quarter of 2013, from 17.6% to 20.7%, likely reflecting purchases of health coverage on the marketplace insurance exchanges introduced by the ACA.
Medicaid shows the second-largest increase among insurance sources. The nearly two-point increase in this type of coverage, which caters to lower-income and disabled Americans, likely stems from the ACA’s Medicaid expansion provision that offered additional federal funding to states that expanded Medicaid eligibility.
Gallup and Sharecare began asking Americans about the source of their health insurance using the current question wording in August 2013, in anticipation of shifts in how people would receive their health insurance after the healthcare exchanges opened. Gallup asks Americans, “Is your primary health insurance coverage through a current or former employer, a union, Medicare, Medicaid, military or veteran’s coverage, or a plan fully paid for by you or a family member?” Gallup also asks whether they have secondary health insurance coverage and, if so, what type of coverage it is. The results reported here are a combined estimate of primary and secondary insurance types.
Implications
After campaigning on a promise to repeal the Affordable Care Act, Donald Trump and Republicans in Congress have so far failed to offer an alternative that satisfies their various constituencies. The GOP healthcare plan was panned by conservative Republicans who demanded additional reforms, while Democrats and moderate Republicans balked at Congressional Budget Office estimates indicating millions of Americans could lose their coverage under the plan.
Meanwhile, Americans’ opinions of the ACA have improved considerably since last fall, with a majority approving of the law for the first time in Gallup’s trend back to 2012. Since November 2016, all partisan groups have become increasingly supportive of the law, including a 10-point increase among Republicans and a 17-point bump among independents.
The healthcare legislation debate remains unsettled, and it is unclear how soon President Trump and Congress will attempt to pass revised legislation. Several insurers have announced that they are abandoning some health exchanges in 2018, suggesting that coverage options could diminish and premiums could surge in the near future in some states.
The slight rise in the number of uninsured Americans in the first quarter of 2017 could, in part, be attributable to the uncertainty surrounding the long-term future of the Affordable Care Act. As such, it will be important to monitor the uninsured trends in the coming months as these events unfold. If coverage options and premiums do change, members of Congress from both parties may show a renewed urgency to address the healthcare issue.
SURVEY METHODS
These results are based on telephone interviews conducted Jan. 2-March 31, 2017, as part of the Gallup-Sharecare Well-Being Index survey, with a random sample of 44,596 adults, aged 18 and older, living in all 50 U.S. states and the District of Columbia. For results based on the total sample of national adults, the margin of sampling error is ±1 percentage point at the 95% confidence level. All reported margins of sampling error include computed design effects for weighting.
Each sample of national adults includes a minimum quota of 70% cellphone respondents and 30% landline respondents, with additional minimum quotas by time zone within region. Landline and cellular telephone numbers are selected using random-digit-dial methods.
Learn more about how the Gallup-Sharecare Well-Being Index works.


