STORY HIGHLIGHTS
- Uninsured rate reaches nine-year low
- Rate down 6.2 points since individual mandate took effect
- Uninsured rate has dropped most among low-income households, Hispanics
WASHINGTON, D.C. — In the third quarter of 2016, 10.9% of U.S. adults were without health insurance, representing a new low in Gallup’s and Sharecare’s nearly nine years of trending the rate of uninsured. This is down from 11.9% in the fourth quarter of 2015, before the 2016 open enrollment period that allowed U.S. adults to obtain insurance through the government health insurance exchanges.
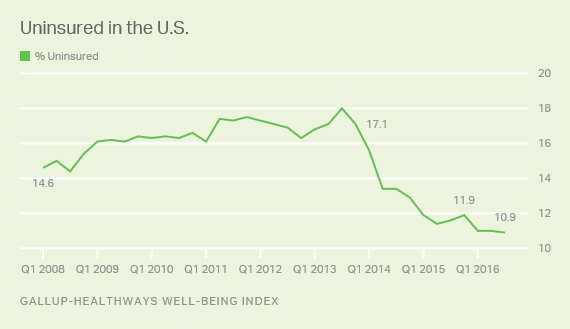
The uninsured rate has declined 6.2 percentage points from 17.1% in the fourth quarter of 2013, right before the Affordable Care Act’s requirement that Americans carry health insurance took effect in early 2014.
Results for the third quarter are based on approximately 44,000 interviews with U.S. adults aged 18 and older from July 1- Sept. 30, 2016, conducted as part of the Gallup-Sharecare Well-Being Index. Gallup asks 500 U.S. adults each day whether they have health insurance, which, on an aggregated basis, allows for precise and ongoing measurement of the percentage of Americans with and without health insurance.
Largest Change Among Low-Income Households and Hispanics
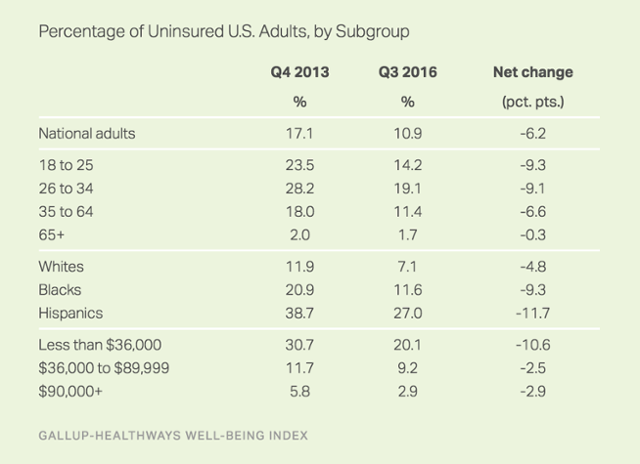
Among key groups, the largest declines in the uninsured rate between the last quarter of 2013 and the third quarter of 2016 took place among low-income households and Hispanics. However, these groups remain the ones with the highest uninsured rates. In the fourth quarter of 2013, 30.7% of low-income Americans were uninsured, compared with 20.1% in the third quarter of 2016. In the last quarter of 2013, 38.7% of Hispanics were uninsured, compared with 27.0% in the third quarter of 2016.
Largest Change Among Self-Paid Plans
To assess changes among Americans with different types of insurance coverage, Gallup and Sharecare focus on adults aged 18 to 64, because nearly all of those aged 65 and older have Medicare. Since the fourth quarter of 2013, the largest change has occurred among those with an insurance plan fully paid for by themselves or their families, most likely reflecting insurance purchased on the government’s health insurance exchanges or individual plans purchased directly from an insurer. In the final quarter of 2013, 17.6% of U.S. adults aged 18 to 64 were insured through these individually purchased health insurance plans, compared with 21.5% in the third quarter of 2016. The percentage of Americans with Medicaid coverage has also risen as the percentage who are uninsured has declined.
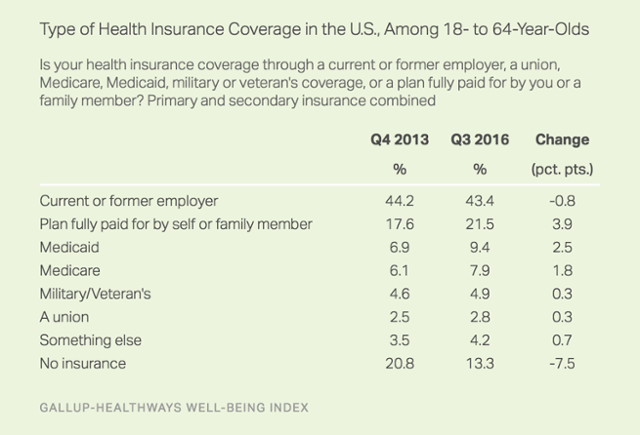
Gallup and Sharecare began asking Americans about the source of their health insurance using the current question wording in August 2013, in anticipation of shifts in how people would receive their health insurance through the Affordable Care Act. Respondents are asked, “Is your primary health insurance coverage through a current or former employer, a union, Medicare, Medicaid, military or veteran’s coverage, or a plan fully paid for by you or a family member?” Respondents are also asked if they have secondary health insurance coverage and, if so, what type of coverage it is. The results reported here are a combined estimate of primary and secondary insurance types.
Implications
The sharp declines in the uninsured rates in the first year of the individual mandate and insurance exchanges have leveled off. The declines remained mostly steady in the third year after the introduction of the individual mandate, from 11.9% in the fourth quarter of 2015 to 10.9% in the third quarter of 2016. These changes in the second and third years after the individual mandate went into effect are not surprising since the remaining uninsured are likely among the hard-to-reach populations or those most resistant to complying with the law. Additionally, a majority of the states that have expanded Medicaid coverage did so early in 2014; since that time, Medicaid expansion has occurred gradually, one state at a time.
The fourth open enrollment period, set to begin on Nov. 1, will be a critical one for the law. In some states and counties, consumers who have or are seeking insurance through government exchanges or direct purchase with insurers will see higher premiums and fewer insurers offering individual policies. Results from the first quarter of 2017 will illustrate how these rate increases may affect the percentage of U.S. adults who remain without health insurance.
SURVEY METHODS
Results are based on telephone interviews conducted July 1-Sept. 30, 2016, as part of the Gallup-Sharecare Well-Being Index survey, with a random sample of 44,028 adults, aged 18 and older, living in all 50 U.S. states and the District of Columbia. For results based on the total sample of national adults, the margin of sampling error is ±1 percentage point at the 95% confidence level. Each quarter dating to Quarter 1, 2014, has approximately 44,000 respondents. Each quarter from 2008 through 2013 has approximately 88,000 respondents.
Each sample of national adults includes a minimum quota of 60% cellphone respondents and 40% landline respondents, with additional minimum quotas by time zone within region. Landline and cellular telephone numbers are selected using random-digit-dial methods.
Learn more about how the Gallup-Sharecare Well-Being Index works.