STORY HIGHLIGHTS
- Uninsured rate down 6.1 points since individual mandate took effect
- Uninsured rate down most among Hispanics and blacks
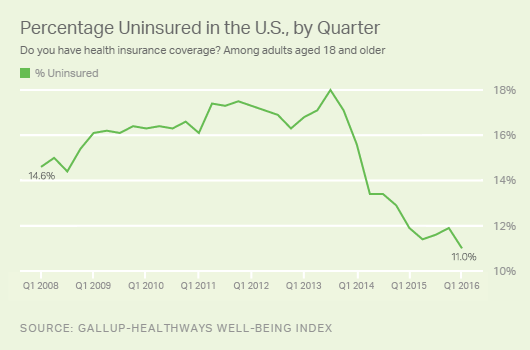
WASHINGTON, D.C. — In the first quarter of 2016, the uninsured rate among all U.S. adults was 11.0%, down from 11.9% in the fourth quarter of 2015. This marks a record low since Gallup and Sharecare began tracking the uninsured rate in 2008. The uninsured rate has declined 6.1 percentage points since the fourth quarter of 2013, which was right before the individual mandate provision of the Affordable Care Act took effect in early 2014 that required Americans to carry health insurance.
Results for the first quarter are based on nearly 45,000 interviews with U.S. adults aged 18 and older, from Jan. 2 to March 31, 2016, conducted as part of the Gallup-Sharecare Well-Being Index. Gallup and Sharecare ask 500 U.S. adults each day whether they have health insurance, which, on an aggregated basis, allows for precise and ongoing measurement of the percentage of U.S. adults with and without health insurance and the net change in the uninsured rate over time.
The uninsured rate for the first quarter accounts for interviews conducted both before and after the Jan. 31 deadline to purchase a 2016 health plan from government insurance exchanges. The percentage without health insurance in the second quarter of 2016 may decline slightly, as it will be the first quarterly measurement this year to reflect interviews that were all conducted after the exchanges closed.
Uninsured Rate Declines Most Sharply Among Hispanics and Blacks
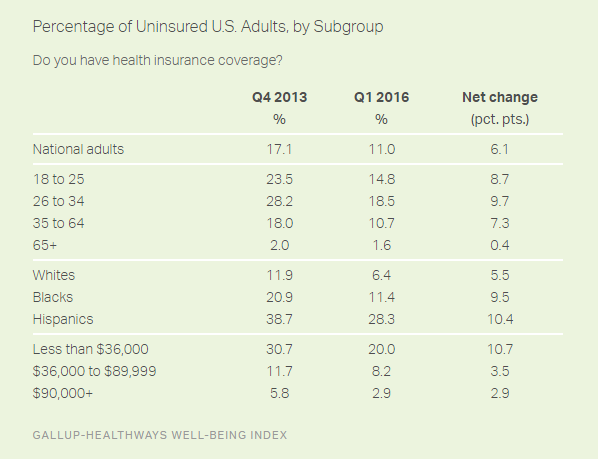
Across key subgroups, blacks and Hispanics have experienced the largest declines in their uninsured rates since the fourth quarter of 2013. The rate among Hispanics was 28.3% in the first quarter of 2016, still significantly higher than for all U.S. adults, but down 10.4 points from the fourth quarter of 2013. Similarly, the uninsured rate has declined 9.5 points among blacks over this same period to its current 11.4%. These larger declines for blacks and Hispanics partly reflect higher uninsured rates among those demographic groups relative to whites before the implementation of the new healthcare law.
The uninsured rate has declined significantly for all age groups below age 65 since late 2013. Seniors, most of whom were already covered by Medicare before the recent changes in health insurance took place, continue to almost universally report being insured.
More Americans Have Self-Paid and Medicaid Insurance Plans
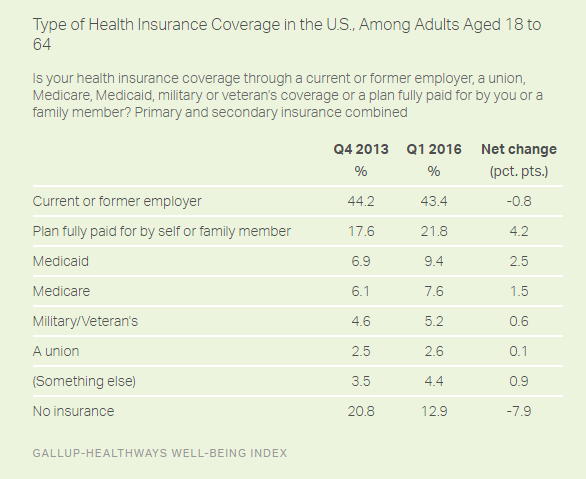
Gallup and Sharecare focus on adults aged 18 to 64 because nearly all Americans 65 and older have Medicare. Compared with the fourth quarter of 2013, the largest increase in insurance type has occurred among those paying for a plan themselves. In the first quarter of 2016, 21.8% of U.S. adults aged 18 to 64 had a plan fully paid for by themselves or a family member, up 4.2 percentage points from the fourth quarter of 2013. The percentage of U.S. adults with Medicaid has also increased to 9.4% in the first quarter of 2016, up 2.5 points from the fourth quarter of 2013.
Implications
The uninsured rate has dropped considerably since the fourth quarter of 2013 when the key provision of the new healthcare law requiring U.S. adults to obtain health insurance took effect. After declining significantly in earlier quarters, the rate of uninsured U.S. adults leveled off in 2015. Most healthcare policy watchers had anticipated this, as those who remain uninsured are among the most difficult to insure. The drop in the first quarter of 2016 suggests that the rate may continue to decline in future years, although less markedly and maybe only in the first quarter of each year as U.S. adults continue to make use of the exchanges to obtain health insurance.
The open enrollment period concluded on Jan. 31, 2016, meaning slight changes are expected in the second quarter of 2016 when the totality of interviews are conducted after the exchanges have closed, but further significant changes to the uninsured rate are unlikely until the first quarter of 2017.
SURVEY METHODS
Results are based on telephone interviews conducted Jan. 2-March 31, 2016, as part of the Gallup-Sharecare Well-Being Index survey, with a random sample of 44,557 adults, aged 18 and older, living in all 50 U.S. states and the District of Columbia. For results based on the total sample of national adults, the margin of sampling error is ±1 percentage point at the 95% confidence level. Each quarter dating to the first quarter of 2014 has approximately 44,000 respondents. Each quarter from 2008 through 2013 has approximately 88,000 respondents.
Each sample of national adults includes a minimum quota of 60% cellphone respondents and 40% landline respondents, with additional minimum quotas by time zone within region. Landline and cellular telephone numbers are selected using random-digit-dial methods.
Learn more about how the Gallup-Sharecare Well-Being Index works.


