STORY HIGHLIGHTS
- U.S. federal workers have edge in financial well-being over other workers
- Financial differences consistent across income, education
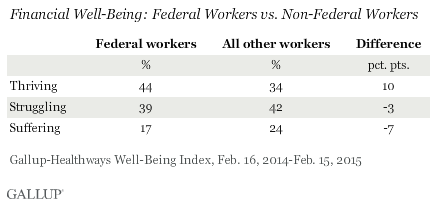
WASHINGTON, D.C. — U.S. federal government workers are thriving in their financial well-being more than the rest of the workforce. On average, 44% of federal government employees are thriving financially, compared with 34% of all other workers in the U.S.
These findings are based on more than 80,000 interviews conducted with U.S. adults, aged 18 and older, who were employed full time from Feb. 16, 2014-Feb. 15, 2015 as part of the Gallup-Sharecare Well-Being Index. For each of the five elements of well-being, Gallup classifies respondents as “thriving” (well-being that is strong and consistent), “struggling” (well-being that is moderate or inconsistent), or “suffering” (well-being that is low and inconsistent).
Federal pay has been a topic of debate for years, with differing accounts of whether federal employees are paid more, no more or less than non-federal employees. However, financial well-being is not a direct report of salary, benefits or overall compensation. It is a composite of responses to the perceptions of standards of living, affordability of basic necessities and financial woes based on region of country, family size, cost of living, debt and various other factors that go into subjective assessments of financial situations.
Given this description, it is possible for a person to have a higher salary but experience lower financial well-being. But for those who experience higher levels of financial well-being, they feel as if they can spend time and energy addressing other facets of well-being in their day-to-day lives, including their purpose, social, community and physical well-being. These data show that federal employment is likely associated with higher levels of economic stability and reductions in the stress of providing for a comfortable lifestyle because federal workers report higher financial well-being.
Across Income and Education Levels, Federal Employees Still Thrive More
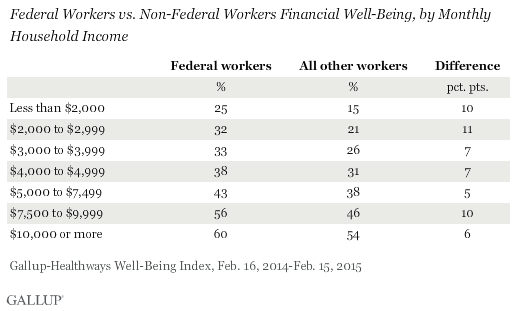
While some have claimed that federal employees earn more than those working outside the federal government, the differences in financial well-being remain consistent when examining household income levels. A quarter of federal employees whose monthly household income is less than $2,000 are thriving in financial well-being, compared with 15% of workers outside the federal government, a difference of 10 percentage points. While thriving differences between federal and non-federal employees vary somewhat across income levels — such as those households who earn $5,000 to $7,499 a month — federal employees consistently have higher financial well-being.
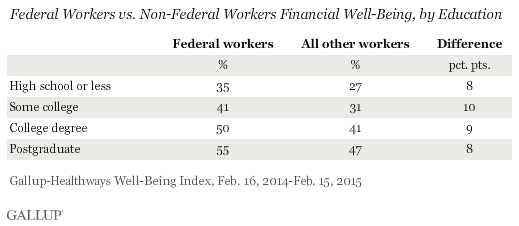
The same trends of higher levels of thriving for federal government workers are seen across educational attainment. More than a third (35%) of federal employees with a high school degree or less are thriving, compared with about a quarter (27%) of those working outside of the U.S. government, and these differences continue at each higher level of education, including an eight-point difference in thriving among those with a postgraduate education.
In 2012, the Congressional Budget Office found that less-educated federal employees made more money than their non-federal counterparts and more educated federal employees made less. Conventional wisdom might suggest then that the differences in financial well-being between less-educated federal and non-federal employees would be greater than the differences between those with more education. However, these differences between federal and non-federal employees’ financial well-being across education levels are similar, including a matching eight-point difference for those with a high school degree or less and for those with a postgraduate degree. Again, these data suggest that income may not be the basis for high financial well-being.
Implications
Gallup research defines financial well-being as managing one’s economic life to reduce stress and increase security. Financial well-being is not necessarily related to absolute income, but rather to approaches to saving and spending and future expectations of job security, among other subjective factors. The survey data indicate that working for the federal government is associated with higher financial well-being when compared with other U.S. workers, holding across income and education levels. Federal workers reporting higher levels of financial well-being could mean good news for the U.S. government because financial well-being is a crucial aspect of overall well-being, which has a significant effect on healthcare costs and engagement on the job.
Many government agencies streamline benefits enrollment for employees that are “opt-out,” or able to be set up once and automated to minimize financial stress on a regular basis, such as automated public transportation benefits. Beyond employer benefits, the U.S. Office of Personnel Management (OPM) transparently publishes salary information, which may not be as frequently available in the general workforce, making career paths fairly clear as to one’s position in an organization. OPM also guarantees and regulates benefits so federal workers can feel secure that something unexpected will not affect their well-being.
To explain why there may be gaps in financial well-being between federal workers and all other workers, the fact that over 50% of the working population work for small businesses means that if those small business are not thriving, those employees may not be reporting high levels of financial well-being.
SURVEY METHODS
Results are based on telephone interviews conducted Feb. 16, 2014-Feb. 15, 2015, as part of the Gallup-Sharecare Well-Being Index survey, with a random sample of 80,223 adults, aged 18 and older, employed full time and living in all 50 U.S. states and the District of Columbia. For results based on the total sample of national adults, the margin of sampling error is ±2 percentage points at the 95% confidence level.
Each sample of national adults includes a minimum quota of 50% cellphone respondents and 50% landline respondents, with additional minimum quotas by time zone within region. Landline and cellular telephone numbers are selected using random-digit-dial methods.
Learn more about how the Gallup-Sharecare Well-Being Index works.


