States in Northeast Lead Nation in Dentist Visits
Reposted with permission from Gallup
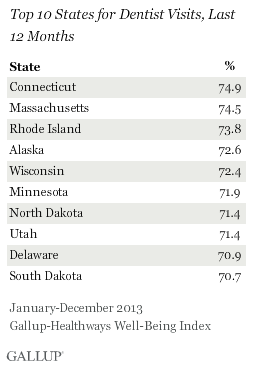
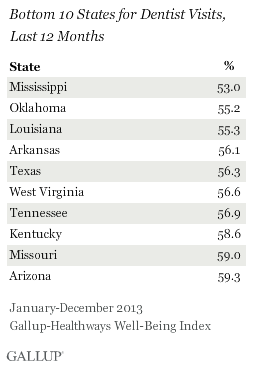
WASHINGTON, D.C. — For the third year in a row, Connecticut residents were the most likely to say they visited a dentist in the last 12 months. It is one of only three states, the others being Massachusetts and Rhode Island, where nearly three in four residents visited a dentist. Just over half of the residents in Mississippi say the same, coming in last for dental care among the 50 states.

Five states, Connecticut, Massachusetts, Rhode Island, Wisconsin, and Minnesota, have ranked in the top 10 states for dental visits every year since Gallup and Sharecare began daily tracking in 2008. Connecticut has taken the top spot four times — from 2011 through 2013, and in 2009. On the other hand, eight states — Mississippi, Oklahoma, Louisiana, Arkansas, Texas, West Virginia, Tennessee, and Kentucky — have ranked in the bottom 10 every year since 2008.
Nationally, 64.7% of Americans in 2013 said they visited the dentist at least once in the past 12 months. This is essentially unchanged from 65.4% in 2012, and remains in line with the averages reported in previous years since 2008.These findings are based on interviews with more than 178,000 American adults conducted during 2013 as a part of the Gallup-Sharecare Well-Being Index. Respondents were asked whether they visited the dentist in the last 12 months.
Annual Dentist Visits Most Common in Northeast, Least Common in South
The state-level results illustrate that dental visits vary by geographic region. Residents of Eastern states are the most likely to report visiting the dentist in the past year and hold the top three positions in the state rankings. Residents in the Midwest are the second-most likely to report visiting the dentist in the past year, and four Midwestern states are included within the top 10 for 2013. Residents of Southern states are the least likely to go to the dentist and make up eight of the bottom 10 states for dental visits.
Dentist Visits Related to Having Money for Healthcare and Insurance Rates
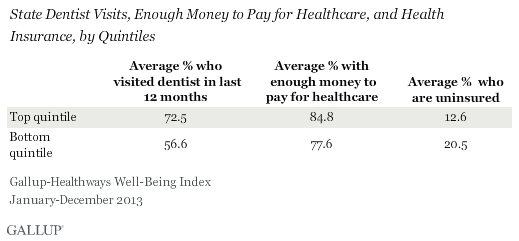
Residents of the 10 states with the highest dental visit rates are somewhat more likely to say they have enough money to pay for healthcare than residents in the 10 states with the lowest dental visit rates, 84.8% vs. 77.6%. Further, the bottom 10 states for dental visits have a significantly higher average uninsured rate at 20.5% than the top 10 states for dental visits (12.6%). Previous Gallup research shows that the likelihood of visiting the dentist annually increases with income, which bolsters the connection between obtaining professional dental care and affordability.
Implications
The American Dental Association recommends visiting the dentist regularly to maintain oral health, noting that the frequency should be determined by a dentist based on an individual’s personal risk profile. Even those with a low risk profile should have at least one dental visit per year, while those at higher risk benefit from more frequent visits. In 11 states, less than 60% of residents reported that they visited the dentist at least once in the last year, revealing a wide disparity between actual dental visits and best practice oral care.
A relationship between dental visits and income exists, and those states with fewer reported visits also have, on average, a relatively lower percentage of residents with enough money to pay for healthcare and a higher percentage of uninsured residents.
It is possible that the full implementation of the Affordable Care Act and the declining percentage of uninsured Americans will boost annual dental visit rates. Some adult coverage options that were available for purchase through the federal and state exchanges included dental coverage, in addition to stand-alone dental insurance options. However, there is no fine associated with not having dental coverage under the ACA.
Even if previously uninsured Americans do not obtain dental insurance along with health coverage, physicians may advise them to consider their oral care as a critical aspect of their overall health.
Gallup’s “State of the States” series reveals state-by-state differences on political, economic, and well-being measures Gallup tracks each day. New stories based on full-year 2013 data will be released in the coming months.
To view the full report on well-being in the U.S., visit this page.
SURVEY METHODS
Results are based on telephone interviews conducted as part of the Gallup-Sharecare Well-Being Index survey Jan. 2-Dec. 29, 2013, with a random sample of 178,072 adults, aged 18 and older, living in all 50 U.S. states and the District of Columbia.
The margin of sampling error for most states is ±1 to ±2 percentage points, but is as high as ±4 points for states with smaller populations, such as Wyoming, North Dakota, South Dakota, Delaware, and Hawaii.
Interviews are conducted with respondents on landline telephones and cellular phones, with interviews conducted in Spanish for respondents who are primarily Spanish-speaking. Each sample of national adults includes a minimum quota of 50% cellphone respondents and 50% landline respondents, with additional minimum quotas by time zone within region. Landline and cellular telephone numbers are selected using random-digit-dial methods. Landline respondents are chosen at random within each household on the basis of which member had the most recent birthday.
Samples are weighted to correct for unequal selection probability, nonresponse, and double coverage of landline and cell users in the two sampling frames. They are also weighted to match the national demographics of gender, age, race, Hispanic ethnicity, education, region, population density, and phone status (cellphone only/landline only/both, and cellphone mostly). Demographic weighting targets are based on the most recent Current Population Survey figures for the aged 18 and older U.S. population. Phone status targets are based on the most recent National Health Interview Survey. Population density targets are based on the most recent U.S. census. All reported margins of sampling error include the computed design effects for weighting.
In addition to sampling error, question wording and practical difficulties in conducting surveys can introduce error or bias into the findings of public opinion polls.
For more details on Gallup’s polling methodology, visit www.gallup.com.

