Sharecare Community Well-Being Index Methods
Development of the 2019 Well-Being Index
Overview. The development of the 2019 WBI included four unique steps. Step 1 involved harmonization of individual-level data across three independent data sources. Step 2 involved mode adjustment to calibrate individual level data collected through mail and digital modalities. Step 3 included spatial mapping of individual zip codes to counties within state and Step 4 involved small area estimation and multiple imputation to generate state-level WBI scores for the ranking analysis. Each step is described in detail below.
Data Harmonization. Sharecare and BUSPH collected 364,025 cross-sectional surveys using digital and mail modalities. The digital RealAge platform includes enrollments throughout the year, and represents 84.2% of the sample. Mail surveys, collected in the intervention communities during selected timeframes within the year, represent 4.3% of the sample. Additional digital surveys were deployed via an online survey collection platform to ensure census-based comprehensive coverage, and represent 11.5% of the sample. WBI scoring algorithms were applied to item-level data to develop WBI and sub-domain scores based on modality. Demographic characteristics (i.e., age, sex, race, marital status, education and income) and corresponding response options were harmonized across all data sources, including census data (Claritas) and are summarized in Table 1.
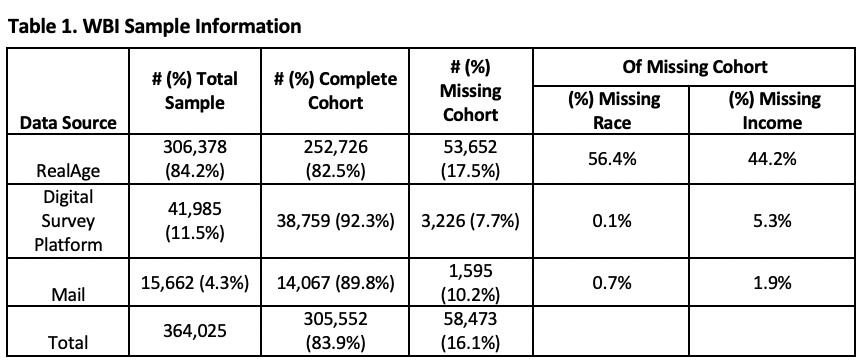
The final individual-level sample used in our rankings report contains complete WBI, zip code and demographic characteristics from 305,552 respondents.
We identified 58,473 respondents (16.1%) with missing WBI, invalid or missing zip code (352 respondents) or missing demographic characteristics. To explore potential differences, we informally compared the cohort of 305,552 respondents with complete data to the cohort with missing data with respect to WBI, demographic characteristics, urban-rural designation[1] and region of the country (i.e., New England, Mid-Atlantic, East North Central, West North central, Mountain and Pacific). Descriptive statistics were generated for WBI, urban-rural designation, region of the country and demographic characteristics by cohort and then stratified by data source. Additional descriptive statistics and data visualizations were generated within strata. No formal statistical testing was performed, due to cohort size, rather the investigation focused on patterns of missingness, whether random or systematic, at the individual level.
There was more missing data in RealAge (17.5%) as compared to data garnered from the other digital survey collection platform (7.7%) and Mail (10.2%) data sources. The proportions of missing race and income data were negligible in the online platform and Mail data sources as compared to RealAge, where among those with missing data, race was missing for 56.4% and income was missing for 44.2% of respondents (Table 1). We observed only small differences in WBI and demographic characteristics of those in the cohort with complete data as compared to the cohort with missing data. Thus, we did not use multiple imputation at the individual-level, but rather performed subsequent demographic adjustment at the county level using census data (described below).
Mode Adjustment. Within a given individual, the modality of survey administration can influence item response, a phenomenon referred to as mode effect (Leeson, 2006). In the absence of proper calibration, the effect of modality can compromise validity. To ensure valid comparisons with prior years and to combine data from our three data sources in 2019, WBI scores obtained digitally were calibrated to scores based on the mail modality, assuming that individuals with similar demographic profiles would report comparable WBI scores across modalities.
Regression tree methods using recursive partitioning were applied to 2018 WBI data collected by mail from 106,515 respondents to develop demographic profiles (e.g., males 65 years of age and older living in urban areas) for analysis. Prior to performing regression tree analysis, each response option within each candidate demographic characteristic was examined for sufficiency. Specifically, we required that each response option had at least 200 respondents, and if not, response options were combined. Linear transformations of WBI scores were generated for each demographic profile identified through the regression tree analysis, ensuring that the means and standard deviations of the WBI scores obtained digitally (122,946 respondents) were equivalent to those obtained by mail within each demographic profile. These transformations were then applied to the 2019 WBI data obtained digitally.
Spatial Mapping. WBI data were captured at an individual-level along with zip codes of residence. The Social Determinants of Health index (SDOHi), was derived at the county level. Because zip codes and county boundaries did not perfectly align, we used the Office of Housing and Urban Development zip code-to-county weighted crosswalk to calculate county residential population weights. Zip codes that crossed multiple counties were assigned resident ratios for each county proportional to the number of residences in that county. Respondents were then assigned to counties using these resident ratios as probability weights. Data from 23,176 zip codes were assigned to 2,946 counties.
WBI Measure Development. The unit of analysis for the ranking report is the state. We first estimated individual-level linear mixed effects models with random intercepts for counties, relating WBI to demographic characteristics and urban-rural designation (Sullivan LM, 1999). Next, we developed demographic profiles for each county using census (Claritas) data and compared these to the profile of WBI respondents within that county. Using the linear mixed effects model, we generated two small-area estimates of mean WBI for each county, one based on respondent data and the other based on the census-derived demographic profile. These two estimates were used to produce a demographically adjusted WBI score for each county that was comprised of the estimate of WBI based on the census-derived demographic profile and the difference between the observed WBI for the county and the estimate of WBI based on the respondent data, with weighting by the number of respondents in counties with fewer than 30 respondents. These weighted estimates provide county-level mean WBI (or subscale) scores that are better aligned with a demographically representative sample of the county population for counties with small numbers of respondents and more variable estimates. Among 2,946 counties with respondent data, 1,111 (38%) had 30 or more respondents per county and 1,835 (62%) had less than 30 respondents per county. An additional 194 counties had no respondents. Multiple imputation was used to impute WBI scores for the 2,029 counties with fewer than 30 respondents to maintain appropriate levels of uncertainty for these estimates. Ten county level datasets were imputed of county-level means using the approach outlined above for WBI and each of the five sub-domain scores. Standard errors were calculated using Rubin’s rule. These imputed county-level estimates were combined with the non-imputed data from counties with more than 30 respondents, giving a total of 3,140 counties, with weighting proportional to population size, to produce state-level mean WBI and means of each of the five sub-domains, which were used for ranking.
Because the overall WBI and five sub-domain scores were treated independently in separate analyses, we assessed the extent to which the five sub-domains reflected the overall ranking using machine learning. Based on 2018 data, we trained a model to predict overall WBI as a function of the five sub-domain scores. For this, we explored several learning approaches including linear regression, non-negative least squares regression and random forests. The random forest exhibited the best overall performance and was applied to the 2019 data, where it assigned top 20 ranks to 19 of the 20 states that were in the top 20 based on the 2019 WBI ranking, derived as described above This indicates strong concordance between overall WBI ranking and sub-domain scores. The random forest missed the 16th ranked state and instead included the 21st ranked state.
Development of the Social Determinants of Health Index (SDOHi)
The importance of social determinants of health in shaping an individual’s ability to achieve health and longevity has been well established. In 2019, Sharecare and BUSPH began collecting over 600 items measuring domains of SDOH using various spatial and temporal scales, including the American Community Survey, United States Department of Agriculture, Area Health Resources, National Park Service, United States Geological Survey, Centers for Disease Control and Prevention (CDC) and National Aeronautics and Space Administration, and more.
Our first-generation SDOH indices mirrored the CDC Healthy People 2020 framework measuring five interrelated, underlying domains: neighborhood and built environment, health and health care, social and community context, education and economic stability. Our goal was to develop six SDOH indices, one overall index and five sub-domain indices. From the pool of 600 items, we first selected candidate items for consideration, based on expert opinion, literature review, competitive intelligence and prior experience. Second, each candidate item was evaluated based on unique content, distributional properties and whether the item was available for all US counties. As a final step, candidate items were included in a principal components analysis to reduce the number of items retained while maximizing variance explained, forcing five components and examining both varimax and promax rotations. This iterative process resulted in the first generation of SDOH indices that included 59 items, measured in 3,140 counties (of 3,142) across the US.
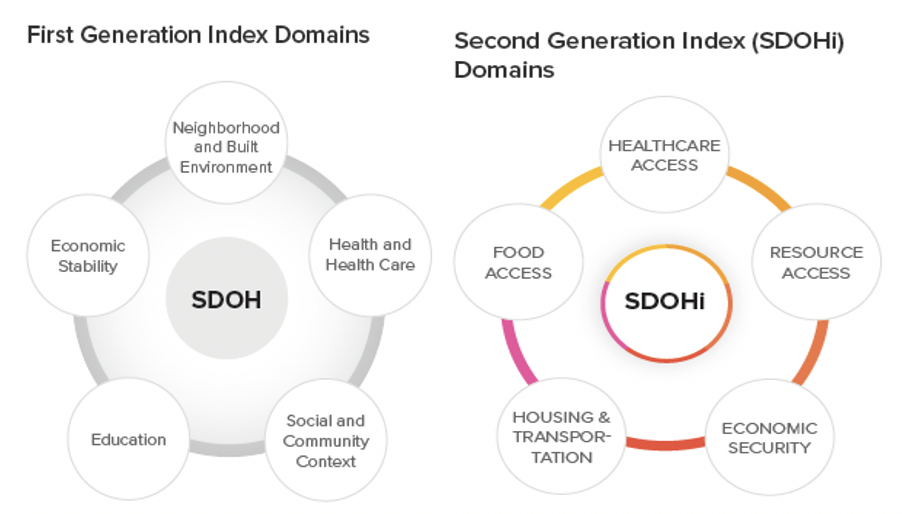
- Healthcare access: Concentration of MDs, OBGYNs, and pediatric specialists per 1,000 residents
- Food access: Presence of grocery stores within one mile of underserved populations, including Black individuals, children, and seniors
- Resource Access: Quantity of libraries and religious institutions per 10,000 residents, employment rates for people over 65, and presence of grocery stores within 20 miles
- Housing & Transportation: Home values, ratio of home value to income, and public transit use
- Economic Security: Rates of employment, labor force participation, individuals with health insurance coverage, and household income above poverty level
The state-level SDOHi scores were created by aggregating county-level SDOHi scores with weights proportional to county population sizes.
Development of the Community Well-Being Index (CWBI)
The newly developed CWBI combined county-level WBI scores and county-level SDOHi scores assigning equal weight to each, by aggregating county-level scores with weights proportional to county population sizes. The CWBI now characterizes 3,140 (99.9%) of counties in the United States, representing the most comprehensive assessment of individual and community health and well-being in our history.
[1] Based on tract-level Rural Urban Commuting Area codes developed by the Office of Rural Health Policy using Census guidelines.