Sharecare Community Well-Being Index Methodology

The Community Well-Being Index is the key metric used in our annual ranking reports and is comprised of two inter-related concepts: The Well-Being Index and the Social Determinants of Health Index. These two indices are combined into a single score that represents self-reported individual health-related behaviors and perceptions incorporating the individual’s living environment. Each year, Sharecare and the Boston University School of Public Health (BUSPH) Biostatistics and Data Analytics Center (BEDAC) optimize strategies to obtain individual data, incorporate social determinants of health metrics and refine statistical and geospatial methodologies.
Development of the Well-Being Index
Overview. The development of the Well-Being Index (WBI) includes four steps. Step 1 involves the collection of individual data through digital modalities that include the Sharecare platform and targeted, supplemental digital surveys. Step 2 includes spatial assignment of individual zip codes to one of over 3,142 US counties and Step 3 includes data integrity checks. Step 4 applies statistical methods that include multiple-imputation of missing demographics data, small area estimation, and standardization approaches to generate county-level WBI scores.
Data Collection. Each year, Sharecare and BUSPH BEDAC develop a data collection strategy using Census-based demographic characteristics to capture individual level data. Our goal is to obtain a representative sample of the adult population including over 90% of US counties. Over 400,000 individuals provide data annually. Approximately 80% of the sample is collected through Sharecare’s digital platforms and supplemental digital surveys are deployed through a digital survey mechanism to ensure that our data collection strategy targets are achieved. Individual item-level data collected between the platforms are harmonized to ensure comparability.
Spatial Assignment. Individual-level data are collected at the zip code level and linked to US counties. Individuals residing in zip codes that overlap with two or more counties are assigned to one of the overlapping counties using probability weighting based on population proportions. These weights are determined by residential ratios in zip-to-county crosswalks from the US Department of Housing and Urban Development.
Data Integrity. Descriptive statistics are generated to investigate potential bias and patterns of missingness between individuals with complete data to those with missing data with respect to WBI values, demographic characteristics, urban-rural designation, and region of the country stratified by data source.
Statistical Methods. Multiple imputation of missing demographic characteristics are performed using standard statistical approaches, here, ten complete demographic respondent-level datasets are generated. Prior to 2020, mode adjustmenta was performed to combine data from individuals using different modalities (mail, digital) and for continuity of prior year methods. Based on current literature and our small area estimation and standardization approach, mode adjustment for mail and digital modalities will not be performed prospectively1-6.
Small area estimation is performed using respondent-level linear mixed effects models with random intercepts for counties, relating WBI to demographic characteristics and urban-rural designation7. Demographic profiles for each county using census data are generated and compared to demographic profiles for respondents within that county. Using the linear mixed effects model estimates, two small-area estimates of mean WBI for each county are generated, one based on individual data (if available) and the other standardized from the census-derived demographic profile. These two estimates are used to produce a county-level WBI score adjusted for demographic characteristics that are comprised of the estimate of WBI standardized from the census-derived demographic profile and the difference between the observed WBI for the county and the estimate of WBI based on individual data, weighted by the number of individuals in counties with fewer than 30 respondents. These imputed county-level mean WBI scores reflect values in greater alignment with a demographically representative sample of the county population. Counties with no respondent data are further imputed using the mean based on their county demographic profiles. Ten county level datasets are created from the ten multiple imputed demographic respondent-level datasets for WBI and select survey items. Standard errors are computed based on the number of respondents in the county, and are corrected for the multiple imputation of demographic characteristics using Rubin’s Rule to maintain appropriate levels of uncertainty for these estimates. National, state, and MSA level scores are created using weights proportional to county population size. Standard errors for the national, state, and MSA means are calculated using the county-level standard errors computed using Rubin’s rule.
Mode adjustment in the event of multiple data collection modalities. Within a given individual, the modality of survey administration can influence item response, a phenomenon referred to as mode effect8, this methodology was applied to align with prior methods. Digital WBI data collected prior to 2020 were calibrated to scores based on the mail modality, assuming that individuals with similar demographic profiles report comparable WBI scores across modalities.Regression tree methods using recursive partitioning were applied to develop demographic profiles (e.g., males 65 years of age and older living in urban areas) for analysis. Prior to performing regression tree analysis, each response option within each candidate demographic characteristic was examined for sufficiency. Specifically, we required that each response option had at least 200 respondents, and if not, response options were combined.
Development of the Social Determinants of Health Index (SDOHi)
The importance of social determinants of health in shaping an individual’s ability to achieve health and longevity has been well established9,10. In 2019, Sharecare and BUSPH began collecting over 600 items measuring domains of SDOH using various spatial and temporal scales, including the American Community Survey, United States Department of Agriculture, Area Health Resource File, National Park Service, United States Geological Survey, Centers for Disease Control and Prevention (CDC), National Aeronautics and Space Administration, and more.
Our first-generation SDOH indices mirrors the CDC Healthy People 2020 framework measuring five interrelated, underlying domains: neighborhood and built environment, health and health care, social and community context, education and economic stability. Our goal was to develop six SDOH indices, one overall index and five sub-domain indices. From the pool of 600 items, we first selected candidate items for consideration, based on expert opinion, literature review, competitive intelligence and prior experience. Second, each candidate item was evaluated based on unique content, distributional properties and whether the item was available for all US counties. As a final step, candidate items were included in a principal components analysis to reduce the number of items retained while maximizing variance explained, forcing five components and examining both varimax and promax rotations. This iterative process resulted in the first generation of SDOH indices that includes 59 items, measured in counties across the US.
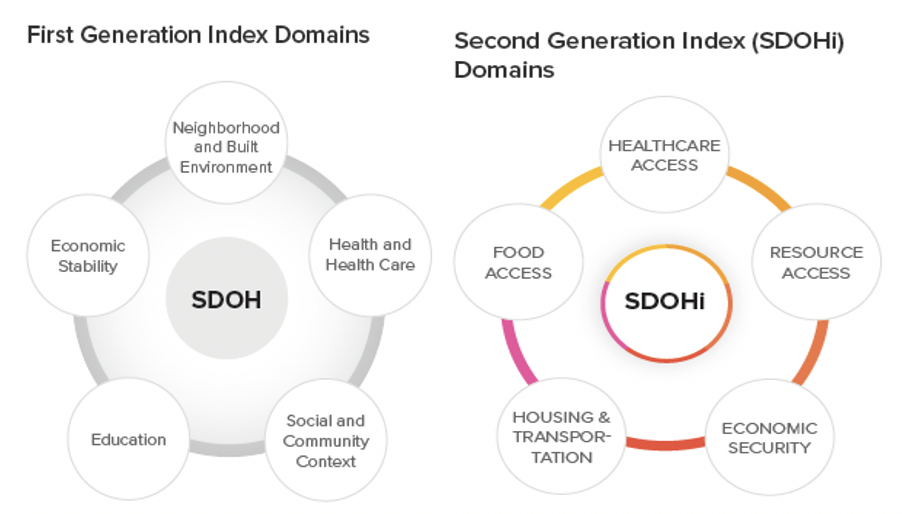
Our second-generation SDOH index (SDOHi) used a data driven approach to obtain the most parsimonious solution. Using iterative structural equation techniques, including confirmatory factor analysis, we formally tested our hypothesized conceptual model of five underlying domains. The model with the best fit included 17 items that explained more variability in key outcomes than our first-generation index which included 59 items. The second generation SDOHi includes all 17 items, measuring five interrelated domains:
- Healthcare access: Concentration of MDs, OBGYNs, and pediatric specialists per 1,000 residents
- Food access: Presence of grocery stores within one mile of underserved populations, including Black individuals, children, and individuals over 65 years of age
- Resource Access: Quantity of libraries and religious institutions per 10,000 residents, employment rates for people over 65, and presence of grocery stores within 20 miles
- Housing and Transportation: Home values, ratio of home value to income, and public transit use
- Economic Security: Rates of employment, labor force participation, individuals with health insurance coverage, and household income above poverty level
Annual county-level SDOHi scores were created by aggregating standardized county-level SDOHi items.
Development of the Community Well-Being Index (CWBI)
The county-level WBI scores and county-level SDOHi scores are combined assigning equal weight to each. County-level scores with weights proportional to county population size were aggregated to the MSA- and state-level for reporting. The CWBI characterizes every county in the United States, representing the most comprehensive assessment of individual and community health and well-being in Sharecare history.
References
- Cantuaria ML, Blanes-Vidal V. Self-reported data in environmental health studies: mail vs. web-based surveys. BMC Med Res Methodol. 2019;19: 238. doi:10.1186/s12874-019-0882
- McCabe SE, Diez A, Boyd CJ, Nelson TF, Weitzman ER. Comparing web and mail responses in a mixed mode survey in college alcohol use research. Addict Behav. 2006;31: 1619–1627. doi:10.1016/j.addbeh.2005.12.009
- Helppie-McFall B, Hsu JW. A Test of Web and Mail Mode Effects in a Financially Sensitive Survey of Older Americans. J Econ Soc Meas. 2017;42: 151–169. doi:10.3233/JEM-170444
- Braekman E, Berete F, Charafeddine R, Demarest S, Drieskens S, Gisle L, et al. Measurement agreement of the self-administered questionnaire of the Belgian Health Interview Survey: Paper-and-pencil versus web-based mode. PloS One. 2018;13: e0197434. doi:10.1371/journal.pone.0197434
- Zuidgeest M, Hendriks M, Koopman L, Spreeuwenberg P, Rademakers J. A comparison of a postal survey and mixed-mode survey using a questionnaire on patients’ experiences with breast care. J Med Internet Res. 2011;13: e68. doi:10.2196/jmir.1241
- Beebe TJ, Locke GR, Barnes SA, Davern ME, Anderson KJ. Mixing web and mail methods in a survey of physicians. Health Serv Res. 2007;42: 1219–1234. doi:10.1111/j.1475-6773.2006.00652
- Sullivan LM, Dukes KA, Losina E. Tutorial in biostatistics. An introduction to hierarchical linear modelling. Stat Med. 1999 Apr 15;18(7):855-88. doi: 10.1002/(sici)1097-0258(19990415)18:7<855::aid-sim117>3.0.co;2-7. PMID: 10327531.
- Groves, Robert M. Survey Errors and Survey Costs. 1989. New York: Wiley-Interscience.
- Galea, Sandro, Melissa Tracy, Katherine J. Hoggatt, Charles DiMaggio, and Adam Karpati. Estimated Deaths Attributable to Social Factors in the United States. American Journal of Public Health. 2011. 101(8):1456–65. doi: 10.2105/AJPH.2010.300086.
- Galea, Sandro. Well: What We Need to Talk About When We Talk About Health. 2019. Oxford University Press.