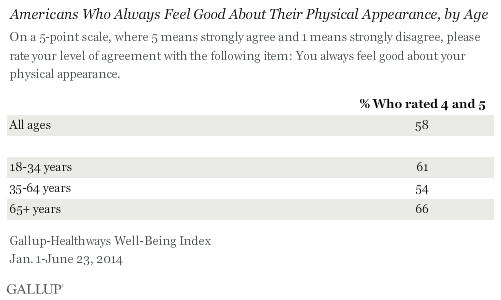
Older Americans Feel Best About Their Physical Appearance
WASHINGTON, D.C. — Though many may pine for the physical appearance they had in their younger years, America’s seniors are the most confident in their looks. Two-thirds (66%) of Americans aged 65 and older “agreed” or “strongly agreed” that they always feel good about their physical appearance, compared with 61% of 18- to 34-year-olds. Middle-aged Americans (54%) are the least likely to report feeling good about their appearance.
For both men and women, confidence in their physical appearance is lower in middle age than in young adulthood, yet gets higher during their senior years.
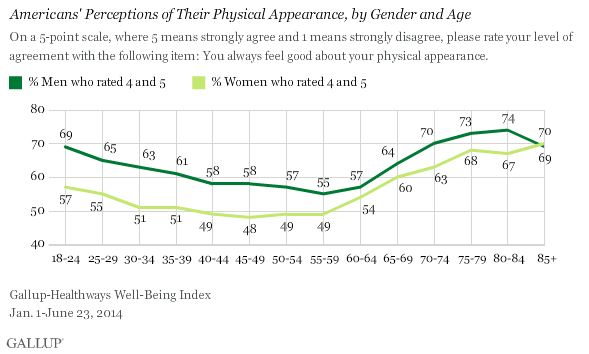
At nearly every age level, men are more likely than women to feel good about their appearance, though this margin narrows among older age groups. More than two in three men aged 18-24 (69%) say they feel good about their physical appearance, compared with the 57% of women in the same age group — a 12-percentage-point gap. But by retirement age, the gap shrinks to a four-point difference: 64% of men feel good about their looks compared with 60% of women.
This analysis is based on more than 80,000 interviews with U.S. adults from Jan. 1-June 23, 2014, as part of the Gallup-Sharecare Well-Being Index. Specifically, Americans are asked to rate their level of agreement with the statement, “I always feel good about my physical appearance,” on a five-point scale where five means strongly agree and one means strongly disagree. Overall, more than half of Americans, 58%, agreed that they always feel good about their looks, answering with a four or five. Far fewer disagreed that they always feel good about their appearance, with 15% answering with a one or two. About one in four Americans (27%) neither agreed nor disagreed, responding with a three.
Blacks and Hispanics More Confident Than Whites in Physical Appearance
Blacks and Hispanics are much more likely than whites and, to a lesser extent, Asians to say they always feel good about their appearance. More than two-thirds of blacks (68%) and Hispanics (67%) report that they are confident in their physical appearance compared with 55% of whites and 62% of Asians.
These patterns by race and ethnicity hold true across most age categories, except that middle-aged blacks and Hispanics are just as happy with their appearance as are middle-aged Asians.
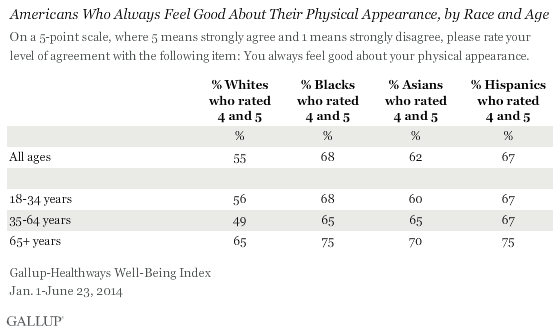
Additionally, only whites’ confidence in their appearance drops sharply in middle age. Blacks, Asians, and Hispanics all maintain their positive perspective on their physical appearance through middle age, and then become even more confident in their golden years.
Bottom Line
Americans’ concern about their physical appearance fuels a huge component of the U.S. economy, extending across clothing, makeup, hair care, weight control, and cosmetic surgery industries. This concern about physical appearance is not totally ill-founded, given that research studies show that attractive people fare better than those perceived as less attractive in many business and social situations.
One’s concern about their appearance is clearly rooted in a combination of subjective and objective factors, and thus it differs according to a variety of demographic and cultural variances, including gender, age, and racial and ethnic background.
Additionally, as people age, perhaps a different set of societal expectations and appearance standards lead to a renewed sense of confidence. In an image-conscious society where beautiful men and women flood the screens and pages of Americans’ various mediums, it isn’t surprising that many are left feeling inadequate. For whites, who are the least likely to feel confident in their physical appearance across all age groups, societal pressure to conform to conventional standards of physical attractiveness takes an even bigger toll.
This study did not include a measure of the actual physical attractiveness of the respondents, so there is no way to judge the relationship between Americans’ confidence in their physical appearance and how others regard them. However, older Americans’ looks are generally out of sync with the youthful standard of beauty that prevails in American culture, and yet they are most happy with what they see in the mirror. Perhaps it will come as a relief to many who toil over minute details of their appearance that they could become happier with their looks in years to come.
SURVEY METHODS
Results are based on telephone interviews conducted as part of the Gallup-Sharecare Well-Being Index survey Jan. 1-June 23, 2014, with a random sample of 85,145 adults, aged 18 and older, living in all 50 U.S. states and the District of Columbia.
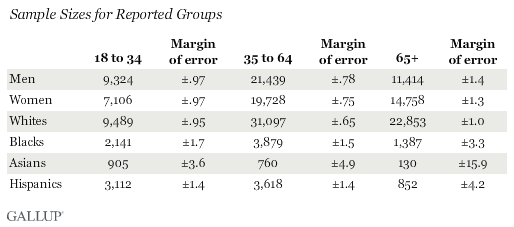
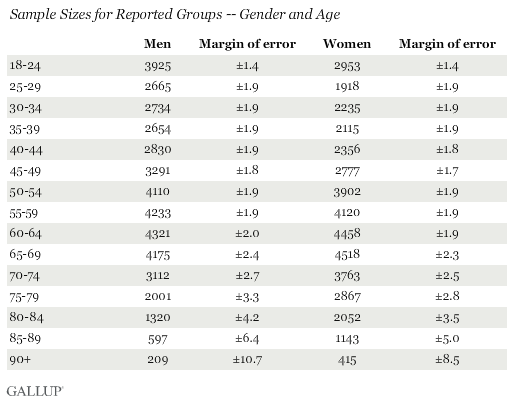
For results based on the total sample of national adults, the margin of sampling error is ±.39 percentage points at the 95% confidence level. Sample sizes for reported sub-groups, however, get smaller and the margin of error can get much higher. The smallest sub-group (Asians 65+) is comprised of 130 respondents, and carries a margin of error of +/-10.5%
Interviews are conducted with respondents on landline telephones and cellular phones, with interviews conducted in Spanish for respondents who are primarily Spanish-speaking. Each sample of national adults includes a minimum quota of 50% cellphone respondents and 50% landline respondents, with additional minimum quotas by time zone within region. Landline and cellular telephone numbers are selected using random-digit-dial methods. Landline respondents are chosen at random within each household on the basis of which member had the most recent birthday.
Samples are weighted to correct for unequal selection probability, nonresponse, and double coverage of landline and cell users in the two sampling frames. They are also weighted to match the national demographics of gender, age, race, Hispanic ethnicity, education, region, population density, and phone status (cellphone only/landline only/both, and cellphone mostly). Demographic weighting targets are based on the most recent Current Population Survey figures for the aged 18 and older U.S. population. Phone status targets are based on the most recent National Health Interview Survey. Population density targets are based on the most recent U.S. census. All reported margins of sampling error include the computed design effects for weighting.
In addition to sampling error, question wording and practical difficulties in conducting surveys can introduce error or bias into the findings of public opinion polls.
For more details on Gallup’s polling methodology, visit www.gallup.com.