STORY HIGHLIGHTS
- Only 30% of Medicaid recipients rate their health positively
- Medicaid recipients more likely than others to be obese, smoke
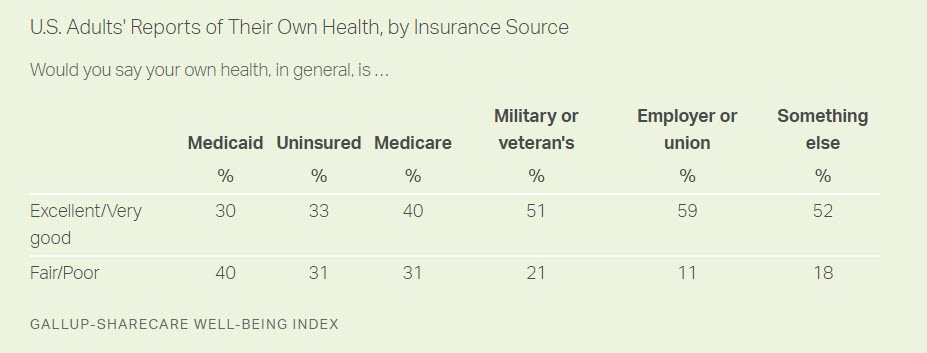
WASHINGTON, D.C. — U.S. adults who receive their healthcare coverage through Medicaid are in worse health than those with other forms of health insurance. Three in 10 adults covered by Medicaid describe their health as ” excellent” or “very good,” compared with 59% of those receiving employer- or union-based insurance and 51% receiving military or veteran’s health insurance. Even the uninsured (33%) and adults covered by Medicare (40%) — which predominantly insures adults aged 65 and older — are more likely than Medicaid recipients to rate their health positively.
These results are based on 147,465 interviews conducted among U.S. adults aged 18 and older Jan. 2-Nov. 5, 2017, as part of the Gallup-Sharecare Well-Being Index. Currently, 9.3% of U.S. adults younger than 65 receive their coverage through Medicaid.
One reason that Medicaid recipients may be less likely to report being in good health is that the system is designed for individuals with disabilities and those in lower-income households who cannot obtain health insurance elsewhere. According to Gallup/Sharecare data, 63% of those insured by Medicaid report a household income of less than $36,000 annually. Gallup research has found a link between poverty and poor health — including much higher rates of physical and emotional health problems.
Medicaid Population Plagued by Chronic Health Conditions
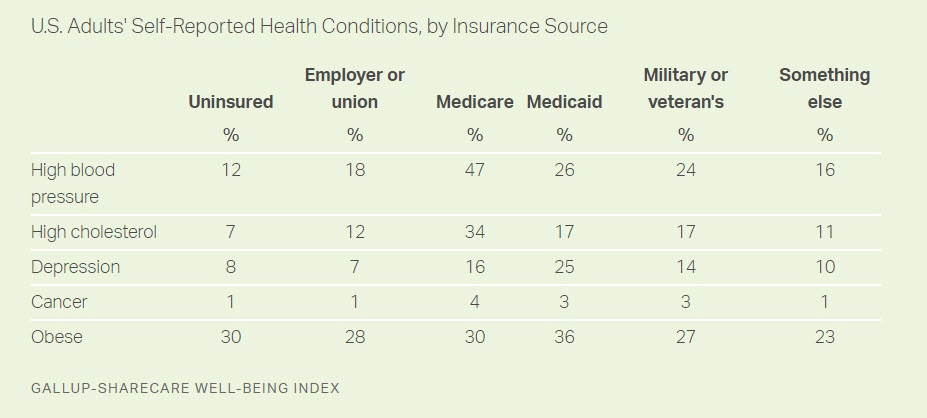
Among adults not covered by Medicare, Medicaid recipients report the highest incidence of chronic health conditions compared with all other groups. Over a third of adults on Medicaid are obese (36%), and a quarter say they suffer from depression — the highest among all insurance groups. Additionally, Medicaid recipients (17%) are significantly more likely to have high cholesterol, trailing only those on Medicare (34%) and on par with those who have military or veteran’s insurance (17%).
The uninsured are the least likely to report having high blood pressure (12%), high cholesterol (7%) or cancer (1%), likely due in part to their younger average age relative to the other insurance groups and the fact that they are not being diagnosed as part of regular medical treatment. Almost a third of uninsured adults (31%) are younger than 30, compared with 20% of adults with some form of health insurance coverage. Eight percent of uninsured adults report being depressed, on par with 7% of those with employer- or union-based coverage who say the same — the lowest of all groups.
Although fewer uninsured adults have been diagnosed with most chronic health conditions, just 33% report having excellent or very good health, with only Medicaid recipients rating their health worse. This may be because those without health insurance are less likely to afford doctor visits and are thus less likely to be diagnosed with and treated for chronic diseases.
The Medicare population — those aged 65 and older — are the most likely of all insurance groups to report having high blood pressure (47%) and high cholesterol (34%) — both conditions for which advanced age is a particularly strong risk factor.
Medicaid Population Most Likely to Smoke
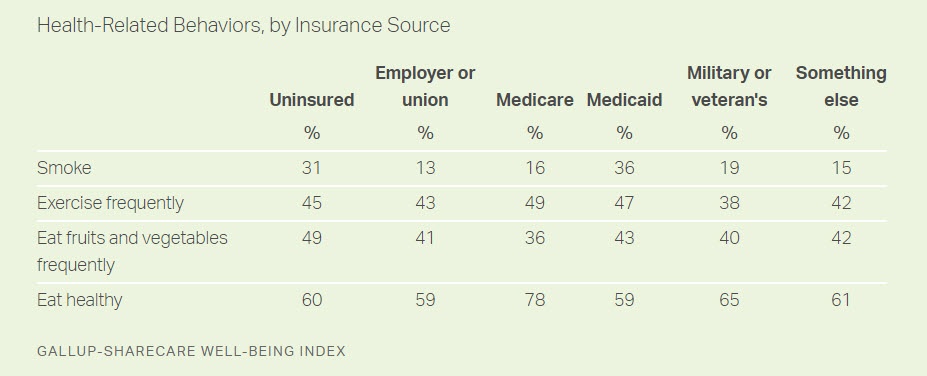
One reason that preventable chronic conditions plague the Medicaid population may be that they are much more likely than other groups to smoke. Over a third of Medicaid recipients (36%) say they smoke, compared with less than a fifth of those in other insurance groups. About three in 10 uninsured adults (31%) say they smoke.
Medicaid recipients are roughly on par with most other insurance groups in their self-reported healthy eating, frequent produce consumption and frequent exercise habits. The uninsured population is the most likely to say they frequently consume fruits and vegetables, while Medicare recipients are the most likely to say they eat healthy.
Implications
Americans spend over $3 trillion each year on medical care — about $9,000 per person — making the U.S. an outlier even among other high-income countries. Despite spending the most on healthcare, the U.S. does not boast the best health-related outcomes. For example, the U.K. spends about $5,000 less per person on healthcare than the U.S. but has a higher average life expectancy and a lower infant mortality rate. Relative to other high-income countries, the U.S. ranks poorly on obesity, life expectancy and other chronic health conditions.
This new analysis suggests that focusing on preventive care for Medicaid patients may help them avoid chronic conditions before they start. The Medicaid population is about twice as likely as other insured adults to smoke and is more likely than all other insured adults — as well as the uninsured — to be obese. Working to reduce unhealthy habits that lead to chronic conditions can improve the health of Medicaid recipients while also decreasing program costs.
SURVEY METHODS
Results are based on telephone interviews conducted Jan. 2-Nov. 5, 2017, as part of the Gallup-Sharecare Well-Being Index survey, with a random sample of 147,465 adults, aged 18 and older, living in all 50 U.S. states and the District of Columbia. For results based on the total sample of national adults, the margin of sampling error is ±1.0 percentage points at the 95% confidence level. For results based on the total sample of 7,457 Medicaid recipients, the margin of sampling error is ±1.6 percentage points at the 95% confidence level. For results based on the total sample of 12,778 uninsured adults, the margin of sampling error is ±1.0 percentage points at the 95% confidence level. All reported margins of sampling error include computed design effects for weighting.
Each sample of national adults includes a minimum quota of 70% cellphone respondents and 30% landline respondents, with additional minimum quotas by time zone within region. Landline and cellular telephone numbers are selected using random-digit-dial methods.
Learn more about how the Gallup-Sharecare Well-Being Index works.


