McAllen, Texas, Residents Least Likely to Feel Safe
Reposted with permission from Gallup
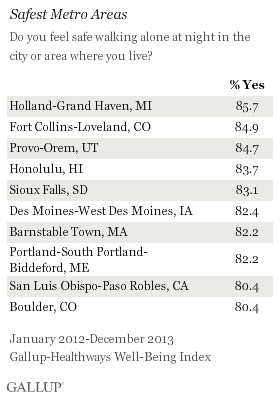
WASHINGTON, D.C. — Less than half of those living in the McAllen-Edinburg-Mission, Texas, community (48.5%) said they feel safe walking alone at night in the area where they live in 2012-2013, the lowest percentage among the 189 metro areas that Gallup and Healthways surveyed. Residents were most likely to feel safe walking unaccompanied after dark in Holland-Grand Haven, Mich. (85.7%), followed by Fort Collins-Loveland, Colo. (84.9%) and Provo-Orem, Utah (84.7%).
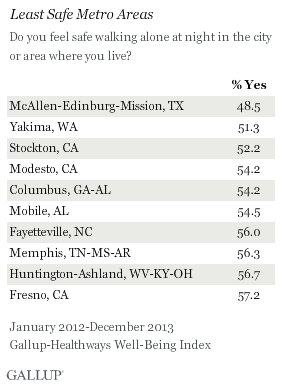
McAllen-Edinburg-Mission was the only community where less than half of residents said they felt safe walking alone at night.
Nationally, an average 70.5% of Americans in 2012-2013 felt safe walking alone in the communities they live in. This measure gives a sense of Americans’ personal security in the area they live, which is most likely linked to local crime rates. This measure also may also be related to the age, gender, and demographic and economic composition of the metro areas, as well as security factors such as law enforcement presence and street lighting.
These results are from the Gallup-Healthways Well-Being Index interviews with at least 300 adults aged 18 and older in each of 189 metro areas over a two-year span, from January 2012 through December 2013. Each metro area sample is weighted to match the demographic characteristics of that area. Gallup categorizes U.S. metro area according to the U.S. Office of Management and Budget’s definitions for Metropolitan Statistical Areas (MSAs).
Link Between Feeling Safe Walking Alone and Being Able to Afford Housing
Community rankings for perceived safety are related to community rankings for a number of other well-being measures affected by socioeconomic factors, but one of the most striking and illustrative is the relationship with the ability to afford housing.
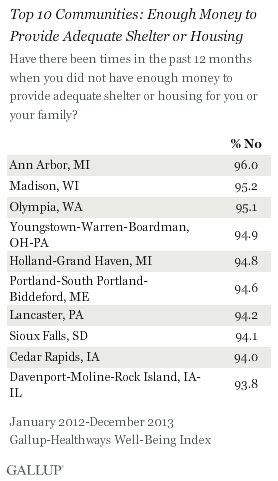
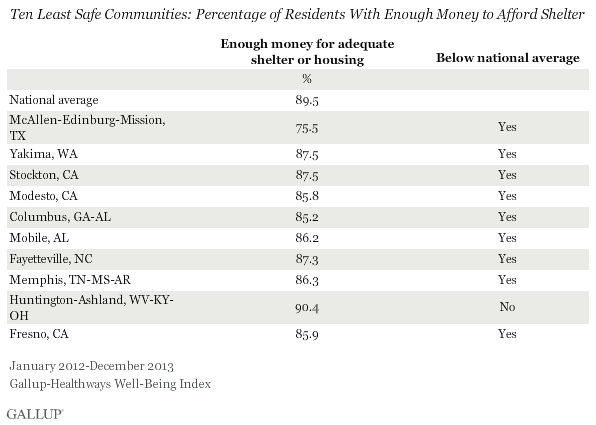
Three communities — McAllen-Edinburg-Mission; Modesto, Calif.; and Columbus, Ga.-Ala. — are among the bottom 10 for both measures, with McAllen-Edinburg-Mission at the very bottom of both lists. Three of the top 10 safest communities also appear on the list of 10 communities that are least likely to struggle to afford housing — Holland-Grand Haven; Sioux Falls, S.D.; Portland-South Portland-Biddeford, Maine.
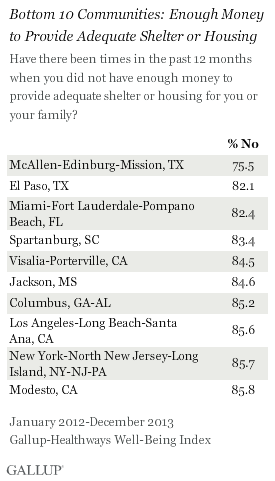
Nationally, 89.5% of Americans, on average, said they had no trouble paying housing costs over the past year. Among the 10 communities where residents felt least safe walking alone, all but one community fell below the national average for residents being able to afford housing in the past year.
Though each measure’s ranking is often indicative of how it will rate on the other, one major exception is Huntington-Ashland, W.Va.-Ky.-Ohio. Residents there were among the least likely nationally to feel safe walking alone, but are above the national average in saying they had no trouble paying for housing costs over the past year.
When looking at the 50 communities where residents felt safest walking alone at night, all but one were above that national average in reporting they did not struggle to afford shelter. Of the 50 communities where residents were least likely to feel safe walking alone at night, 32 of them fell below the national average in terms of struggling to pay for shelter. This underscores the general relationship between economic measures and crime, given the general finding that crime rates are higher in low-income areas across the country.
Bottom Line
While the two measures ask entirely different questions, it’s no coincidence that the communities where residents were least likely to feel safe at night are also among the list of communities where residents were more likely to struggle with housing costs, among other problems. The factors that contribute to both of these problems are often rooted in socioeconomic status and are likely traced back to poverty and the discontent that comes with it.
A key question arising from these data is whether residents’ inability to afford decent housing contributes to their reports of feeling less safe walking alone at night, or if being priced out of the housing market is merely a reflection of the same underlying poverty issues that foster poor safety and security at the community level. The latter possibility is more likely when considered in the context of other related factors, such as health insurance coverage. McAllen-Edinburg-Mission and other communities where residents were less likely to report feeling safe at night are also toward the top of the list for uninsured rates.
Maintaining public safety is one of the most important functions of government and integral to a free society. Both safety and affordable housing are likely related to broader poverty issues, and thus deserve policymakers’ attention.
Survey Methods
Results are based on telephone interviews conducted as part of the Gallup-Healthways Well-Being Index survey Jan. 2-Dec. 29, 2012, and Jan. 2-Dec. 30, 2013, with a random sample of 531,630 adults, aged 18 and older, living in metropolitan areas in the 50 U.S. states and the District of Columbia, selected using random-digit-dial sampling. Two years of data were aggregated together to enable the same number of reportable cities as in prior years, when the overall annual data collection exceeded 350,000 interviews per year compared to 178,072 interviews conducted in 2013. At least 300 cases are required per metro area for reporting.
The metro areas referenced in this article are based on the Metropolitan Statistical Areas (MSAs) as defined by the U.S. Office of Management and Budget. In many cases, more than one city is included in the same MSA. The San Jose, Calif., metropolitan statistical area, for example, also includes the smaller nearby cities of Sunnyvale and Santa Clara in addition to San Jose itself. Each respondent is attributed to his or her MSA based on the self-report of his or her ZIP code, and all metro areas had at least 300 completed surveys in the 2012-2013 data collection period.
Maximum expected error ranges for the Well-Being Index and the sub-index scores vary according to MSA size, ranging from less than 1 point for the largest cities represented to ±1.5 points for the smallest cities.
Interviews are conducted with respondents on landline telephones and cellular phones, with interviews conducted in Spanish for respondents who are primarily Spanish-speaking. Each sample of national adults includes a minimum quota of 50% cellphone respondents and 50% landline respondents, with additional minimum quotas by time zone within region. Landline and cellular telephone numbers are selected using random-digit-dial methods. Landline respondents are chosen at random within each household on the basis of which member had the most recent birthday.
Samples are weighted to correct for unequal selection probability, nonresponse, and double coverage of landline and cell users in the two sampling frames. They are also weighted to match the national demographics of gender, age, race, Hispanic ethnicity, education, region, population density, and phone status (cellphone only/landline only/both, and cellphone mostly). Demographic weighting targets are based on the most recent Current Population Survey figures for the aged 18 and older U.S. population. Phone status targets are based on the most recent National Health Interview Survey. Population density targets are based on the most recent U.S. census. All reported margins of sampling error include the computed design effects for weighting.
In addition to sampling error, question wording and practical difficulties in conducting surveys can introduce error or bias into the findings of public opinion polls.
For more details on Gallup’s polling methodology, visit www.gallup.com.
