Life Evaluations of LGBT Americans Decline After Election
STORY HIGHLIGHTS
- Percentage of LGBT adults “thriving” dropped 10 points after election
- Far fewer Democrats in general classified as thriving after election
- Republican life evaluations improved post-election
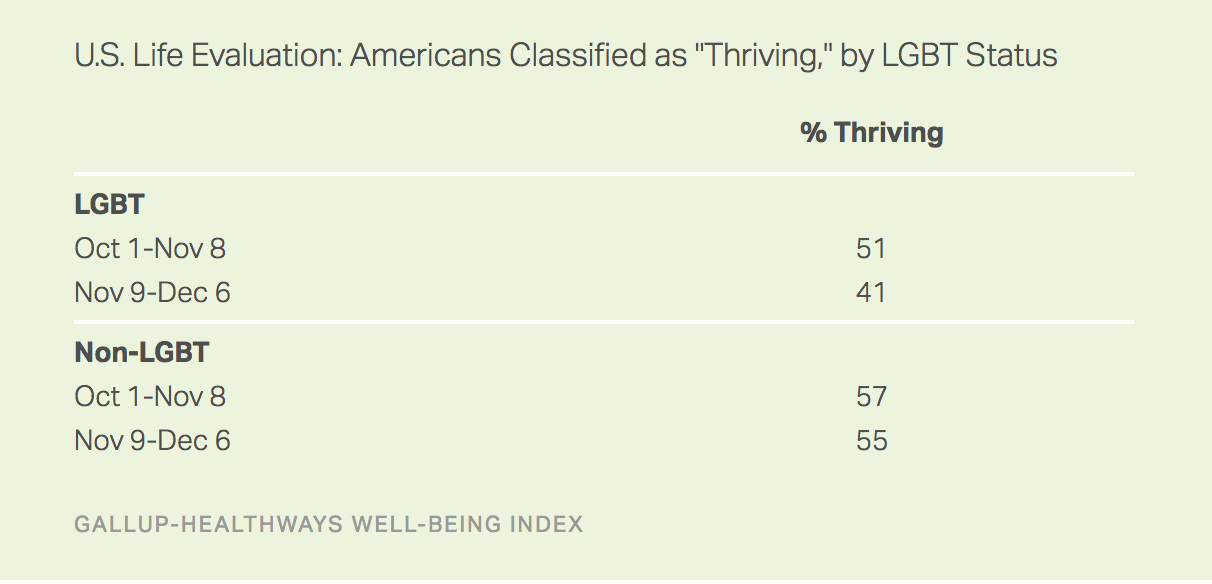
WASHINGTON, D.C. — The election of Donald Trump as president had a significant negative effect on American adults who identify as lesbian, gay, bisexual or transgender (LGBT). The percentage of LGBT adults rating their lives positively enough to be classified as “thriving” declined 10 percentage points after the election, from 51% to 41%. There was little change in life evaluations among non-LGBT Americans.
Americans’ life evaluations are tracked as part of the Gallup-Sharecare Well-Being Index. Gallup and Sharecare classify Americans as “thriving,” “struggling” or “suffering” according to how they rate their current and future lives on a ladder scale with steps numbered from 0 to 10, based on the Cantril Self-Anchoring Striving Scale. Those who rate their present life a 7 or higher and their life in five years an 8 or higher are classified as thriving.
The LGBT community traditionally has been among the most reliable Democratic constituencies. Before the election, Gallup research showed that 12% of LGBT adults had a favorable opinion of Trump, contrasted with a 55% favorable opinion of Hillary Clinton. Additionally, exit polls showed that 77% of LGBT voters picked Clinton on Nov. 8, slightly higher than the 70% who voted for Barack Obama in 2008.
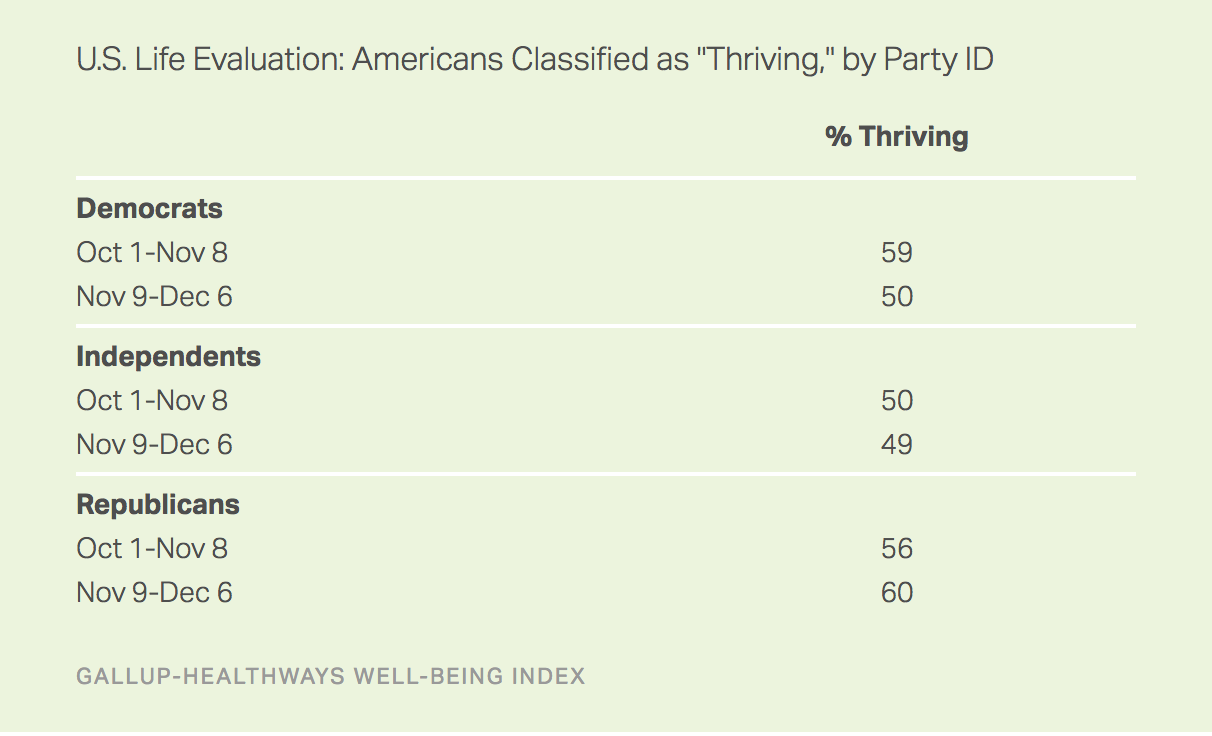
This drop in life evaluations among LGBT adults after the election is part of a more general pattern evident among all Democrats, whose outlook on life also dropped significantly. In the month before the election, Democrats were slightly more likely than Republicans to be classified as thriving (59% to 56%, respectively). That changed after the election, however — 50% of Democrats are now considered thriving (a nine-point drop), compared with 60% of Republicans (a four-point increase).
The large decline in life evaluations among LGBT adults does not appear to be simply a result of their Democratic leanings. Across a variety of demographic characteristics, including gender, race/ethnicity and education, Democrats tend to show large drops in “thriving” while most Republicans report modest increases. However, among LGBT individuals, the 10-point overall decline in “thriving” is seen in both Democrats and Republicans. This suggests that concerns about the prospects of a Trump administration cross party lines among LGBT people.
Bottom Line
Declining life evaluations among those in the losing party after a presidential election are not without precedent. After Obama’s 2012 election, a win for Democrats, Gallup data showed that the percentage of Republicans classified as thriving had dropped from 47% in October to 40% in December. Democrats, on the other hand, increased from 54% to 57%. After Obama’s first election in 2008, life evaluations among racial and ethnic minorities improved — particularly among black Americans — though this was not true after his 2012 win.
The LGBT community has had substantial political success during Obama’s presidency. In his first term, Congress repealed the military’s “don’t ask, don’t tell” policy that barred open service among lesbians, gay men and bisexuals. In 2015, the U.S. Supreme Court ruled that same-sex couples have a constitutional right to marriage. And this year, the Defense Department lifted the ban on transgender people serving openly in the military. The precipitous decline in life evaluations among LGBT Americans after Trump’s election may indicate a particular vulnerability in a group concerned about holding on to these political gains.
SURVEY METHODS
These results are based on telephone interviews with a random sample of 31,898 U.S. adults, aged 18 and older, living in all 50 states and the District of Columbia, conducted Oct. 1-Dec. 6, 2016, as part of the Gallup-Sharecare Well-Being Index survey. Before the election on Nov. 8, 18,736 individuals were surveyed; 13,162 were surveyed after the election. The margin of error varies by subgroup sample size. For political party affiliation, it is ±2 to ±3 percentage points at the 95% confidence level. For LGBT status, it is ±5 percentage points. All reported margins of sampling error include computed design effects for weighting.
Each sample of national adults includes a minimum quota of 60% cellphone respondents and 40% landline respondents, with additional minimum quotas by time zone within region. Landline and cellular telephone numbers are selected using random-digit-dial methods.
Learn more about how the Gallup-Sharecare Well-Being Index works.

