LGBT Americans Report Lower Well-Being
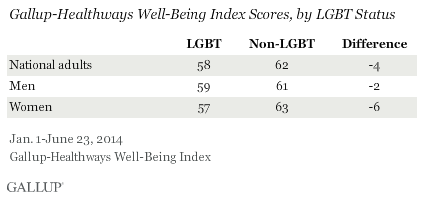
WASHINGTON, D.C. — Americans who identify as lesbian, gay, bisexual, or transgender (LGBT) report lower well-being than non-LGBT Americans. LGBT Americans have an average Well-Being Index score of 58, lower than non-LGBT adults’ score of 62. Importantly, these differences hold true even after taking into account the effects of gender, age, race and ethnicity, educational attainment, state of residence, and population density.
The disadvantage in overall well-being is more acute for LGBT women than for LGBT men. LGBT women have a Well-Being Index score of 57, well below the score of 63 for non-LGBT women. LGBT men also lag behind their non-LGBT counterparts in overall well-being, but not by as much — 59 vs. 61, respectively.
These findings are based on 2,964 interviews with LGBT adults and 81,134 interviews with non-LGBT adults conducted Jan. 1-June 23, 2014, as part of the Gallup-Sharecare Well-Being Index survey. The Well-Being Index is constructed on a scale of 0 to 100, with higher scores indicating better overall well-being. The index includes questions that fall into five broad areas: purpose, social, financial, community, and physical. Each of these well-being elements consists of multiple questions on related topics that Gallup uses to categorize respondents into three groups: thriving, struggling, and suffering.
Across all five elements of well-being, LGBT Americans — particularly LGBT women — trail their non-LGBT counterparts, even after taking into account possible differences in the demographic and geographic characteristics of LGBT and non-LGBT adults.
Financial Well-Being: LGBT Americans’ Biggest Hurdle
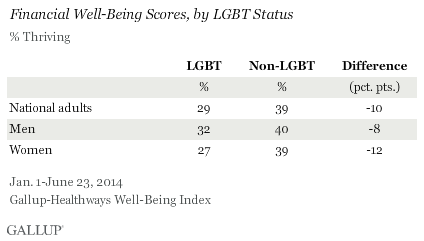
The financial element is where the LGBT community falls furthest behind the non-LGBT population. LGBT Americans are 10 percentage points less likely to be thriving financially than their non-LGBT counterparts. For women, the difference is slightly above average, while for men it is slightly below.
Financial well-being is made up of questions about standard of living, ability to afford basic necessities, and financial worry.
These findings are consistent with research from UCLA’s Williams Institute, which shows that the LGBT population is at a disproportionate risk for poverty and food insecurity.
Physical Well-Being: A Sore Spot for LGBT Women
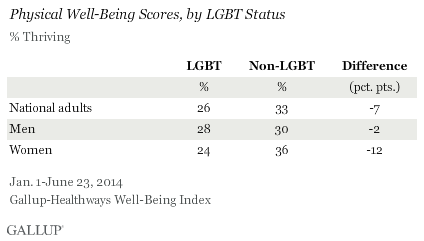
Physical well-being is another area in which there are stark differences between LGBT and non-LGBT Americans, particularly among women. One in three non-LGBT Americans are thriving physically, compared with about one in four LGBT Americans. This difference is entirely driven by LGBT women, as differences by LGBT status among men are not statistically significant.
Physical well-being includes questions related to alcohol, drug, and tobacco use; current disease burden and past diagnoses; exercise; and eating habits.
A variety of factors could contribute to LGBT women’s disproportionately lower physical well-being. A recent analysis of the 2013 National Health Interview Survey reported higher levels of smoking and alcohol consumption among LGB women than among non-LGB women, as well as elevated weight and psychological distress among bisexual women.
Social Well-Being: LGBT Americans Less Likely to Thrive
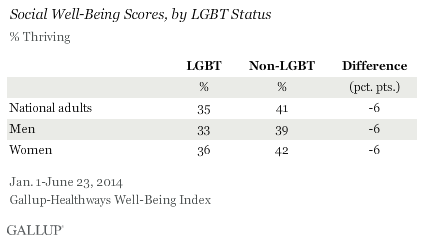
LGBT Americans are less likely than their non-LGBT counterparts to be thriving in their social lives. Thirty-five percent of LGBT adults are thriving socially, compared with 41% of non-LGBT adults. The gaps for men and women are the same.
Social well-being includes questions about relationships with friends and family, personal time, and received encouragement and support.
Community Well-Being: LGBT Women Less Connected to Where They Live
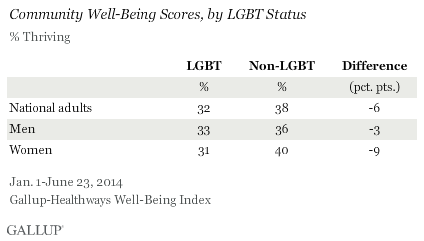
LGBT Americans are less likely than their non-LGBT counterparts to be thriving in community well-being — 32% vs. 38%, respectively. This difference by LGBT status is largely driven by women. LGBT status is not a significant factor in men’s assessments of their communities.
Community well-being includes questions about community pride, involvement, and safety and security.
Purpose Well-Being: LGBT Women Lagging Behind
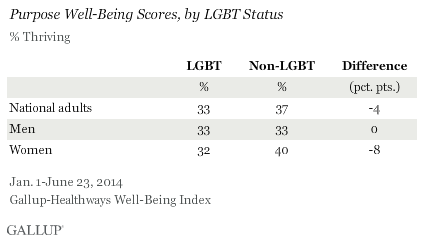
Overall, LGBT Americans trail non-LGBT Americans in reporting a strong sense of purpose in life (33% vs. 37%, respectively). This gap reflects the substantial difference that exists between LGBT women and non-LGBT women. The comparable figures for men do not vary by LGBT status.
Purpose well-being is composed of questions about having an inspiring leader, daily activity, goals, and strengths.
Bottom Line
Despite evidence of decreasing social stigma directed toward the LGBT community in the U.S., LGBT Americans — particularly LGBT women — show a wide range of well-being disparities compared with their non-LGBT counterparts. In measures of physical health, financial security, sense of purpose, social life, and community attachment, data from the Gallup-Sharecare Well-Being Index reveal that LGBT adults experience a wide range of well-being challenges.
These disparities associated with sexual orientation and gender identity highlight the ongoing need for the inclusion of sexual orientation and gender identity measures in data collection focused on health and socio-economic outcomes. Availability of better data that identify the LGBT population will help researchers, healthcare policymakers, and healthcare providers craft better strategies to understand and prevent well-being disparities associated with sexual orientation and gender identity.
SURVEY METHODS
Results are based on telephone interviews conducted as part of the Gallup-Sharecare Well-Being Index survey Jan. 1-June 23, 2014, with a random sample of 2,964 LGBT adults and 81,134 non-LGBT adults, aged 18 and older, living in all 50 U.S. states and the District of Columbia.
For results based on the total sample of LGBT adults, the margin of sampling error is ±2 percentage points at the 95% confidence level.
For results based on the total sample of non-LGBT adults, the margin of sampling error is ±0.4 percentage points at the 95% confidence level.
Interviews are conducted with respondents on landline telephones and cellular phones, with interviews conducted in Spanish for respondents who are primarily Spanish-speaking. Each sample of national adults includes a minimum quota of 50% cellphone respondents and 50% landline respondents, with additional minimum quotas by time zone within region. Landline and cellular telephone numbers are selected using random-digit-dial methods. Landline respondents are chosen at random within each household on the basis of which member had the most recent birthday.
Samples are weighted to correct for unequal selection probability, nonresponse, and double coverage of landline and cell users in the two sampling frames. They are also weighted to match the national demographics of gender, age, race, Hispanic ethnicity, education, region, population density, and phone status (cellphone only/landline only/both, and cellphone mostly). Demographic weighting targets are based on the most recent Current Population Survey figures for the aged 18 and older U.S. population. Phone status targets are based on the most recent National Health Interview Survey. Population density targets are based on the most recent U.S. census. All reported margins of sampling error include the computed design effects for weighting.
In addition to sampling error, question wording and practical difficulties in conducting surveys can introduce error or bias into the findings of public opinion polls.
For more details on Gallup’s polling methodology, visit www.gallup.com.
