STORY HIGHLIGHTS
- Large communities have much better physical health than small towns
- Communities of all sizes have suffered similar well-being declines in 2017
- General life ratings improving for those in small towns and rural areas
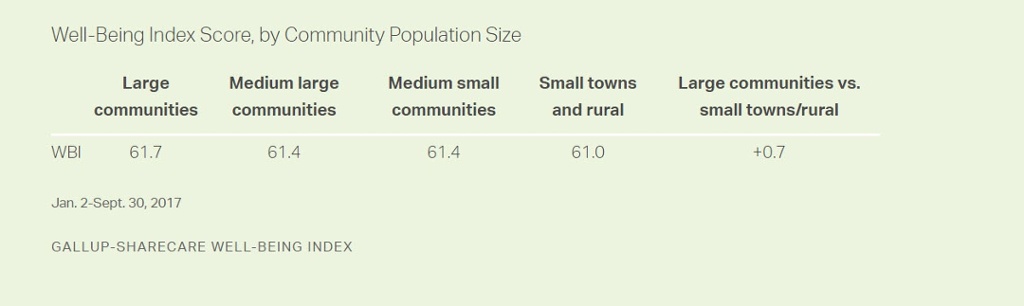
WASHINGTON, D.C. — Residents of highly populated communities have better overall well-being than their counterparts in less populated areas, based on their overall scores on the Gallup-Sharecare Well-Being Index. Overall, large communities have a Well-Being Index score of 61.7 so far in 2017, compared with 61.4 for midsized communities and 61.0 for small towns and rural areas.
These data are drawn from more than 121,000 interviews with U.S. adults across all 50 states from Jan. 2-Sept. 30, 2017. The large sample size means that even small differences in Well-Being Index scores are statistically significant.
The four reporting groups in this article are based on the following definitions:
- Large communities: metropolitan areas with populations of at least 1 million
- Medium large communities: metropolitan areas with populations ranging from 250,000 to less than 1 million
- Medium small communities: metropolitan and “micropolitan” areas with populations ranging from 13,000 to less than 250,000
- Small towns and rural: towns of under 13,000 and those residing in rural areas
The Gallup-Sharecare Well-Being Index is calculated on a scale of 0 to 100, where 0 represents the lowest possible well-being and 100 represents the highest possible well-being. The Well-Being Index score is made up of metrics drawn from each of the five essential elements of well-being:
- Purpose: liking what you do each day and being motivated to achieve your goals
- Social: having supportive relationships and love in your life
- Financial: managing your economic life to reduce stress and increase security
- Community: liking where you live, feeling safe and having pride in your community
- Physical: having good health and enough energy to get things done daily
Small Towns and Rural Areas Lag Behind in Physical Well-Being
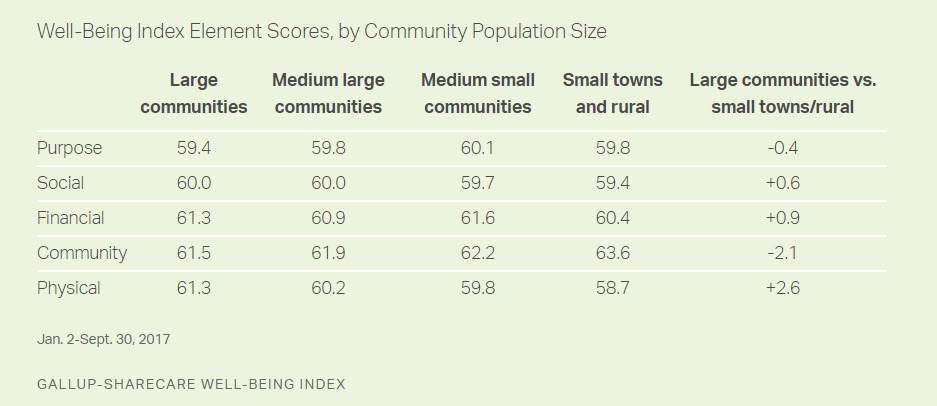
The main reason residents of larger communities have higher well-being is because they have much better physical health, with a score of 61.3 vs. 58.7 in small towns and rural areas. However, residents of smaller communities do have advantages on other key elements of well-being. For example, medium small communities have better purpose and financial well-being than the other three groups, while those who live in small towns and rural areas easily have the best community well-being.
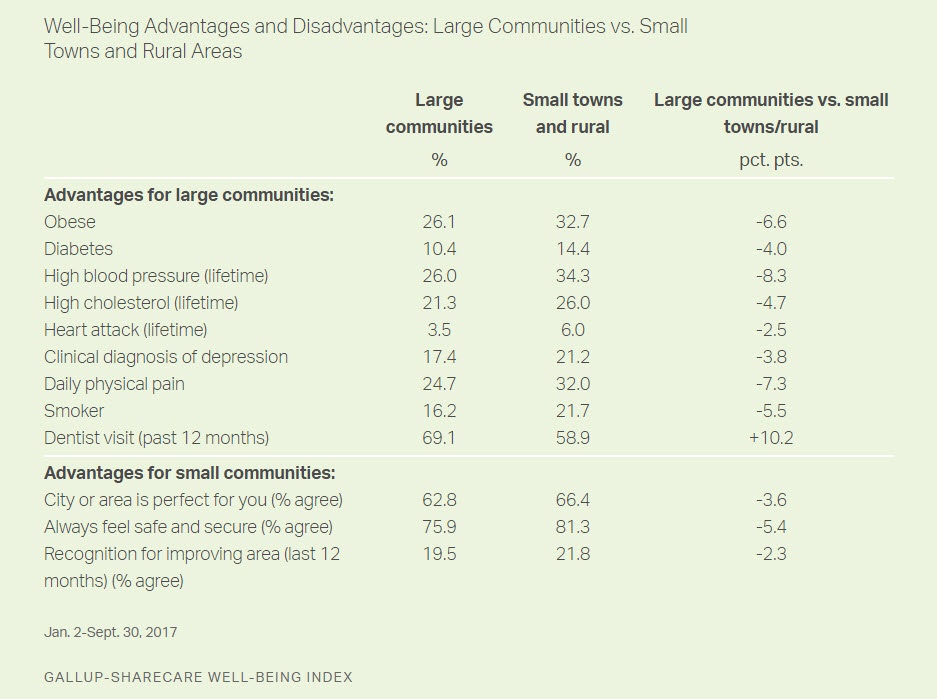
Residents of large communities have higher physical well-being, primarily because of lower rates of obesity and other chronic diseases. They also are more likely to engage in healthy behaviors such as visiting the dentist and not smoking.
On the other hand, residents of small towns and rural areas are more likely to report that they always feel safe and secure, to feel their area is “perfect” for them and to be recognized for volunteering in a way that improves the areas where they live.
Communities of All Sizes Experience Well-Being Declines in 2017
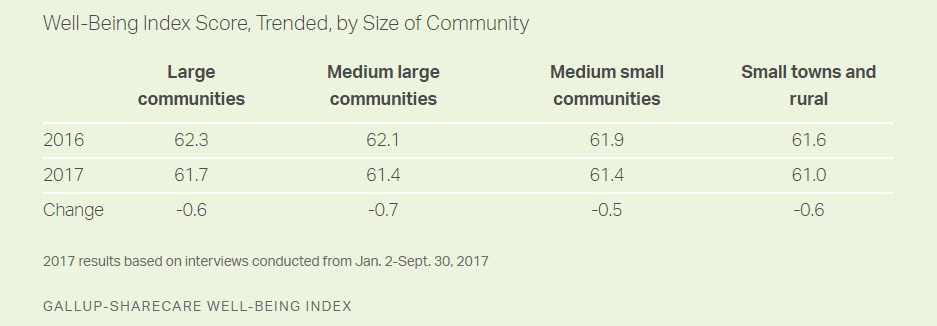
While large and small communities have different well-being advantages, communities of all population sizes have experienced declines in well-being of roughly equal size this year. Together, these declines contribute to a drop in well-being for the nation as a whole this year compared with 2016. Before 2017, well-being in the U.S. had risen for two consecutive years.
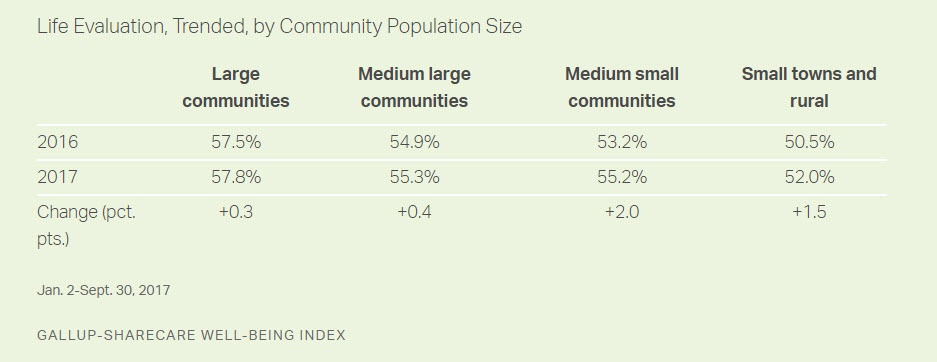
Life Evaluation Edging Up in Small Towns/Rural Areas
Despite the overall decline in well-being, there is a bright spot for those living in medium small communities, small towns and rural areas: a meaningful increase this year in how they evaluate their lives. This measure, known as life evaluation, is a general rating of one’s life today and in the future. People who rate both their current and their future lives highly on the steps of an imaginary ladder, based on the Cantril Self-Anchoring Striving Scale, are considered “thriving.”
The same upward trend in life evaluation has not occurred for those who live in larger communities. Still, as is the case with well-being generally, life evaluation tends to be higher in more populated areas than in less populated areas.
Implications
Well-being is higher for people living in more populated areas than for those living in sparsely populated areas, but communities of different population sizes have different well-being advantages and disadvantages.
Notably, community well-being — liking where you live, feeling safe and having pride in your community — is decidedly better as population size declines. Large communities, in turn, have residents with better physical well-being, possibly attributable to cultural norms and more readily available built infrastructure such as parks, bike paths and fitness centers for enhancing physical health. Those in small towns and rural areas simply have fewer visible healthy lifestyles to emulate and are arguably less culturally incentivized to pursue them.
The decline of well-being generally across all sizes of communities mirrors what is found nationally, but life evaluation more specifically serves as an exception for residents of more sparsely populated areas of the country. The reasons for the uptick in life evaluation within these areas are uncertain, but one possible explanation is that it reflects a more positive reaction to Republican President Donald Trump occupying the White House. Trump’s vote share was significantly higher in medium to small communities and rural areas, and prior research has shown that life evaluation among certain political and demographic groups can change dramatically when control of the White House transitions from one party to the other.
SURVEY METHODS
Results are based on 121,396 telephone interviews with U.S. adults across all 50 states and the District of Columbia, conducted from Jan. 2-Sept. 30, 2017. In 2016, a total of 176,702 interviews were conducted from Jan. 2-Dec. 30. Gallup conducts 500 telephone interviews daily, resulting in a sample that projects to an estimated 95% of all U.S. adults.
The Well-Being Index margin of sampling error for the reported groups is about ±0.3 points. All reported margins of sampling error include computed design effects due to weighting.
Each daily sample of national adults for data collected in 2016 comprises 60% cellphone respondents and 40% landline respondents. Daily samples in 2017 comprise 70% cellphone respondents and 30% landline respondents. Additional minimum quotas by time zone and within region are included in the sampling approach.
Learn more about how the Gallup-Sharecare Well-Being Index works.