Hawaii Reclaims Top Spot in U.S. Well-Being
Reposted with permission from Gallup
STORY HIGHLIGHTS
- Alaska, Montana, Colorado and Wyoming round out the top five
- West Virginia has lowest well-being for the seventh straight year
- Hawaii, Colorado and Montana are only states in the top 10 every year since 2012
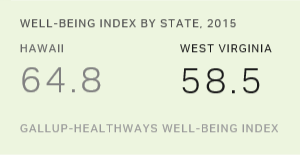
WASHINGTON, D.C. — Hawaii residents had the highest well-being of any state in the nation in 2015, reaching the top spot for the fifth time since Gallup and Sharecare began tracking well-being in 2008. Alaska, which was the top state for well-being in 2014, slipped to second place. Residents of West Virginia and Kentucky have the lowest and second-lowest well-being, respectively, for the seventh consecutive year.
| State | Well-Being Index Score | State | Well-Being Index Score | ||||||||||||||||||||||||||||||||||||||||||||||||||||||||||||||||||||||||||||||||||||||||||||||||
|---|---|---|---|---|---|---|---|---|---|---|---|---|---|---|---|---|---|---|---|---|---|---|---|---|---|---|---|---|---|---|---|---|---|---|---|---|---|---|---|---|---|---|---|---|---|---|---|---|---|---|---|---|---|---|---|---|---|---|---|---|---|---|---|---|---|---|---|---|---|---|---|---|---|---|---|---|---|---|---|---|---|---|---|---|---|---|---|---|---|---|---|---|---|---|---|---|---|---|---|
| Hawaii | 64.8 | West Virginia | 58.5 | ||||||||||||||||||||||||||||||||||||||||||||||||||||||||||||||||||||||||||||||||||||||||||||||||
| Alaska | 64.1 | Kentucky | 60.3 | ||||||||||||||||||||||||||||||||||||||||||||||||||||||||||||||||||||||||||||||||||||||||||||||||
| Montana | 63.8 | Oklahoma | 60.4 | ||||||||||||||||||||||||||||||||||||||||||||||||||||||||||||||||||||||||||||||||||||||||||||||||
| Colorado | 63.6 | Ohio | 60.5 | ||||||||||||||||||||||||||||||||||||||||||||||||||||||||||||||||||||||||||||||||||||||||||||||||
| Wyoming | 63.5 | Indiana | 60.5 | ||||||||||||||||||||||||||||||||||||||||||||||||||||||||||||||||||||||||||||||||||||||||||||||||
| South Dakota | 63.5 | Missouri | 60.8 | ||||||||||||||||||||||||||||||||||||||||||||||||||||||||||||||||||||||||||||||||||||||||||||||||
| Minnesota | 63.3 | Arkansas | 60.9 | ||||||||||||||||||||||||||||||||||||||||||||||||||||||||||||||||||||||||||||||||||||||||||||||||
| Utah | 63.1 | Mississippi | 60.9 | ||||||||||||||||||||||||||||||||||||||||||||||||||||||||||||||||||||||||||||||||||||||||||||||||
| Arizona | 63.0 | Louisiana | 61.1 | ||||||||||||||||||||||||||||||||||||||||||||||||||||||||||||||||||||||||||||||||||||||||||||||||
| California | 62.7 | Georgia | 61.2 | ||||||||||||||||||||||||||||||||||||||||||||||||||||||||||||||||||||||||||||||||||||||||||||||||
| Texas | 62.7 | New York | 61.2 | ||||||||||||||||||||||||||||||||||||||||||||||||||||||||||||||||||||||||||||||||||||||||||||||||
| Florida | 62.4 | Michigan | 61.3 | ||||||||||||||||||||||||||||||||||||||||||||||||||||||||||||||||||||||||||||||||||||||||||||||||
| Wisconsin | 62.4 | Nevada | 61.5 | ||||||||||||||||||||||||||||||||||||||||||||||||||||||||||||||||||||||||||||||||||||||||||||||||
| Iowa | 62.4 | Tennessee | 61.5 | ||||||||||||||||||||||||||||||||||||||||||||||||||||||||||||||||||||||||||||||||||||||||||||||||
| North Dakota | 62.3 | Idaho | 61.5 | ||||||||||||||||||||||||||||||||||||||||||||||||||||||||||||||||||||||||||||||||||||||||||||||||
| GALLUP-SHARECARE WELL-BEING INDEX | |||||||||||||||||||||||||||||||||||||||||||||||||||||||||||||||||||||||||||||||||||||||||||||||||||
Hawaii and Colorado are the only two states that have made the list of the 10 highest well-being states each year since 2008, while Alaska’s well-being was among the top five in the nation for the fifth time. Montana was ranked in the top 10 each year except for 2010, and California had the 10th highest well-being in 2015, its best ranking since finishing ninth in 2008. North Dakota and Iowa, two states that have had multiple high well-being years but were outside of the top 15 in 2014, re-entered this list in 2015.
Most of the lowest well-being states in 2015 have frequented this list in the past.
These state-level data are based on more than 177,000 interviews with U.S. adults across all 50 states, conducted across 350 days from January-December 2015. The Well-Being Index is calculated on a scale of 0 to 100, where 0 represents the lowest possible well-being and 100 represents the highest possible well-being. The Gallup-Sharecare Well-Being Index score for the nation and for each state comprises metrics affecting overall well-being and each of the five essential elements of well-being:
- Purpose: liking what you do each day and being motivated to achieve your goals
- Social: having supportive relationships and love in your life
- Financial: managing your economic life to reduce stress and increase security
- Community: liking where you live, feeling safe and having pride in your community
- Physical: having good health and enough energy to get things done daily
In most cases, a difference of 0.5 to 1.0 point in the Well-Being Index score between any two states represents a statistically significant gap and is characterized by meaningfully large differences in at least some of the individual metrics that make up the overall Gallup-Sharecare Well-Being Index.
The Well-Being Index score for the U.S. in 2015 was 61.7, essentially unchanged from 61.6 in 2014. Gallup and Sharecare have been tracking well-being since 2008 and updated the Well-Being Index survey instrument and scoring methodology in 2014 to provide a more comprehensive measure of well-being. The Well-Being Index scores for 2008-2013 are not directly comparable to the scores for 2014 and 2015 without appropriate adjustments because those prior scores are calculated using some different survey items and a different scoring method. State rankings across years, however, can be compared.
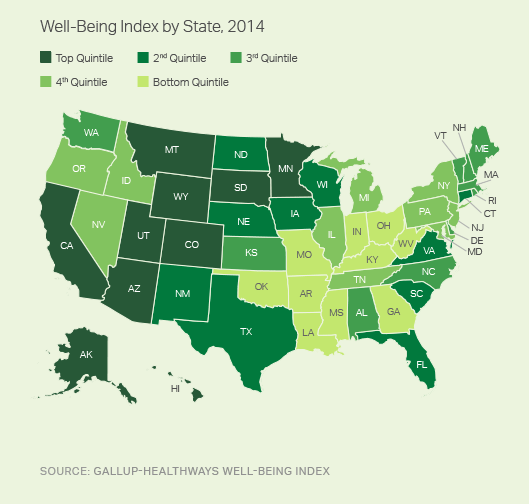
As in prior years, well-being in the U.S. shows regional patterns. The northern Plains and Mountain West are higher well-being areas, along with some western states and pockets of the Northeast and Atlantic. The lowest well-being states are in the south and through the industrial Midwest.
South Carolina Has Best Social Well-Being; Delaware Highest in Purpose
In addition to Hawaii residents having the highest overall well-being, they also had the highest physical well-being nationally. Alaska led all states in financial well-being, just edging out North Dakota. South Carolina residents had the best social well-being, and Delaware had the highest purpose well-being in 2015. Community well-being was highest in Montana.
West Virginians reported the lowest well-being in four of the five elements. The exception was financial well-being, which was lowest in Mississippi.
| Purpose: Highest 5 States |
Social: Highest 5 States |
Financial: Highest 5 States |
Community: Highest 5 States |
Physical: Highest 5 States |
|||||||||||||||||||||||||||||||||||||||||||||||||||||||||||||||||||||||||||||||||||||||||||||||
|---|---|---|---|---|---|---|---|---|---|---|---|---|---|---|---|---|---|---|---|---|---|---|---|---|---|---|---|---|---|---|---|---|---|---|---|---|---|---|---|---|---|---|---|---|---|---|---|---|---|---|---|---|---|---|---|---|---|---|---|---|---|---|---|---|---|---|---|---|---|---|---|---|---|---|---|---|---|---|---|---|---|---|---|---|---|---|---|---|---|---|---|---|---|---|---|---|---|---|---|
| Delaware | South Carolina | Alaska | Montana | Hawaii | |||||||||||||||||||||||||||||||||||||||||||||||||||||||||||||||||||||||||||||||||||||||||||||||
| Texas | Connecticut | North Dakota | Hawaii | Colorado | |||||||||||||||||||||||||||||||||||||||||||||||||||||||||||||||||||||||||||||||||||||||||||||||
| Wyoming | Utah | Hawaii | South Dakota | California | |||||||||||||||||||||||||||||||||||||||||||||||||||||||||||||||||||||||||||||||||||||||||||||||
| Hawaii | Florida | Minnesota | Wyoming | Montana | |||||||||||||||||||||||||||||||||||||||||||||||||||||||||||||||||||||||||||||||||||||||||||||||
| Alaska | Alaska | Iowa | Utah | Connecticut | |||||||||||||||||||||||||||||||||||||||||||||||||||||||||||||||||||||||||||||||||||||||||||||||
| Purpose: Lowest 5 States |
Social: Lowest 5 States |
Financial: Lowest 5 States |
Community: Lowest 5 States |
Physical: Lowest 5 States |
|||||||||||||||||||||||||||||||||||||||||||||||||||||||||||||||||||||||||||||||||||||||||||||||
| West Virginia | West Virginia | Mississippi | West Virginia | West Virginia | |||||||||||||||||||||||||||||||||||||||||||||||||||||||||||||||||||||||||||||||||||||||||||||||
| Vermont | Arkansas | Georgia | New Jersey | Kentucky | |||||||||||||||||||||||||||||||||||||||||||||||||||||||||||||||||||||||||||||||||||||||||||||||
| New Hampshire | North Dakota | Idaho | Maryland | Oklahoma | |||||||||||||||||||||||||||||||||||||||||||||||||||||||||||||||||||||||||||||||||||||||||||||||
| Massachusetts | Oklahoma | West Virginia | New York | Arkansas | |||||||||||||||||||||||||||||||||||||||||||||||||||||||||||||||||||||||||||||||||||||||||||||||
| New York | Missouri | Louisiana | Ohio | Indiana | |||||||||||||||||||||||||||||||||||||||||||||||||||||||||||||||||||||||||||||||||||||||||||||||
| GALLUP-SHARECARE WELL-BEING INDEX | |||||||||||||||||||||||||||||||||||||||||||||||||||||||||||||||||||||||||||||||||||||||||||||||||||
Consistently High- and Low-Performing States in Well-Being
Over the past four years, Hawaii, Colorado, Montana, South Dakota and Minnesota have had the highest average well-being ranks nationally, followed closely by Utah, Nebraska and Iowa. Alaska and Vermont round out the top 10 states for high well-being ranks during this period. Only Hawaii, Colorado and Montana have been in the top 10 each year during this period.
After West Virginia and Kentucky, Ohio, Mississippi and Arkansas are the three states with the lowest well-being ranks in the past four years.
| Highest 10 states | Average rank | Lowest 10 states | Average rank | ||||||||||||||||||||||||||||||||||||||||||||||||||||||||||||||||||||||||||||||||||||||||||||||||
|---|---|---|---|---|---|---|---|---|---|---|---|---|---|---|---|---|---|---|---|---|---|---|---|---|---|---|---|---|---|---|---|---|---|---|---|---|---|---|---|---|---|---|---|---|---|---|---|---|---|---|---|---|---|---|---|---|---|---|---|---|---|---|---|---|---|---|---|---|---|---|---|---|---|---|---|---|---|---|---|---|---|---|---|---|---|---|---|---|---|---|---|---|---|---|---|---|---|---|---|
| Hawaii | 3 | West Virginia | 50 | ||||||||||||||||||||||||||||||||||||||||||||||||||||||||||||||||||||||||||||||||||||||||||||||||
| Colorado | 5 | Kentucky | 49 | ||||||||||||||||||||||||||||||||||||||||||||||||||||||||||||||||||||||||||||||||||||||||||||||||
| Montana | 5 | Ohio | 46 | ||||||||||||||||||||||||||||||||||||||||||||||||||||||||||||||||||||||||||||||||||||||||||||||||
| South Dakota | 6 | Mississippi | 46 | ||||||||||||||||||||||||||||||||||||||||||||||||||||||||||||||||||||||||||||||||||||||||||||||||
| Minnesota | 6 | Arkansas | 45 | ||||||||||||||||||||||||||||||||||||||||||||||||||||||||||||||||||||||||||||||||||||||||||||||||
| Utah | 8 | Indiana | 44 | ||||||||||||||||||||||||||||||||||||||||||||||||||||||||||||||||||||||||||||||||||||||||||||||||
| Nebraska | 9 | Tennessee | 43 | ||||||||||||||||||||||||||||||||||||||||||||||||||||||||||||||||||||||||||||||||||||||||||||||||
| Iowa | 12 | Oklahoma | 43 | ||||||||||||||||||||||||||||||||||||||||||||||||||||||||||||||||||||||||||||||||||||||||||||||||
| Alaska | 13 | Missouri | 42 | ||||||||||||||||||||||||||||||||||||||||||||||||||||||||||||||||||||||||||||||||||||||||||||||||
| GALLUP-SHARECARE WELL-BEING INDEX | |||||||||||||||||||||||||||||||||||||||||||||||||||||||||||||||||||||||||||||||||||||||||||||||||||
Implications
Overall, well-being across the U.S. has shown little improvement since 2008, although there are a number of individual metrics of the Well-Being Index that have improved. These include a decline in the uninsured rate, adecline in the smoking rate and an increase in reported exercise. Food insecurity, defined as not having enough money for food at least once in the last 12 months, has also dropped significantly since 2013 to a seven-year low.
Not all trends have pointed in the positive direction, however. Obesity in the U.S. has continued its relentless upward climb, reaching a new high mark last year. And the trend may continue as half of all overweight adults say they are not seriously trying to lose weight. And among workers, the rate of those working part-time jobs but seeking full-time work has been slow to improve, which is problematic for their well-being, as these “involuntarily part-time” workers exhibit financial well-being that is no better than the unemployed.
Actively seeking improvement in physical wellness is better than doing nothing at all, but research has shown that those who have high well-being across all five elements of well-being perform better than those who are physically fit alone. Those who seek to improve the well-being of their population, including large employers and state and local government leaders, should advocate for a holistic approach to well-being, with a long-term goal of their state being among the highest well-being states in the nation.
SURVEY METHODS
Results are based on telephone interviews conducted Jan. 2-Dec. 30, 2015, as a part of the Gallup-Sharecare Well-Being Index, with a random sample of 177,281 adults, aged 18 and older, living in all 50 U.S. states and the District of Columbia. For results based on the total sample of national adults, the margin of sampling error for the Well-Being Index score is ±0.1 point at the 95% confidence level. The margin of sampling error for most states is about ±0.6 points, although this increases to about ±1.6 points for the smallest population states such as North Dakota, Wyoming, Hawaii and Delaware. All reported margins of sampling error include computed design effects due to weighting.
For data collected prior to Sept. 1, 2015, each sample of national adults includes a minimum quota of 50% cellphone respondents and 50% landline respondents. For data collected between Sept. 1, 2015, and Dec. 30, 2015, each sample of national adults includes a minimum quota of 60% cellphone respondents and 40% landline respondents. Additional minimum quotas by time zone within region are included in the sampling approach.
Learn more about how the Gallup-Sharecare Well-Being Index works.