Sharecare’s Community Well-Being Index & the Georgia Chamber of Commerce
Sharecare’s Community Well-Being Index (CWBI), a data resource that combines data about individuals and the places where they live, work, and play, is an exceptional tool for understanding the health risks and resilience of populations across the country.
As of February 2022, the CWBI instrument as garnered over 4 million survey responses, with over 450,000 collected in the last year, as well as a best-in-class suite of social determinants of health (SDOH) and environmental data. When deploying this data to understand the health problems of populations and places, many interesting, connected insights can be uncovered.
When trying to understand the health of Georgians, and what risks they might be facing, the CWBI offers a single cumulative score, which takes into account 17 SDOH variables and 23 well-being variables, to provide a global context for the personal, economic, environmental, and structural situations that people find themselves in.
As seen in the map below, the distribution of CWBI scores in Georgia, where a higher score indicates better well-being, better infrastructure, and better resource access, show that the Metro Atlanta area, Augusta, and Savannah have higher scores, whereas the middle and southern counties are relatively lower.

At Sharecare, we have explored the relationship between CWBI scores and many health outcomes, and find that the distribution of these scores tend to correlate with health-related risks. Keeping in mind the CWBI scores above, let us also look at the relationship between obesity, diabetes, not meeting fruit and vegetable consumption risks, and stress.

Similar to the distribution of CWBI scores in Georgia, we see that counties located in central and Southern Georgia are at the greatest risk for not eating enough fruits and vegetables. In the Metro Atlanta area, fruit and vegetable risk remains below 33% except for Clayton county, where over 53% of residents demonstrate risk for not eating enough fruits and vegetables.

Obesity Risk, Georgia Severe Diabetes Risk, Georgia

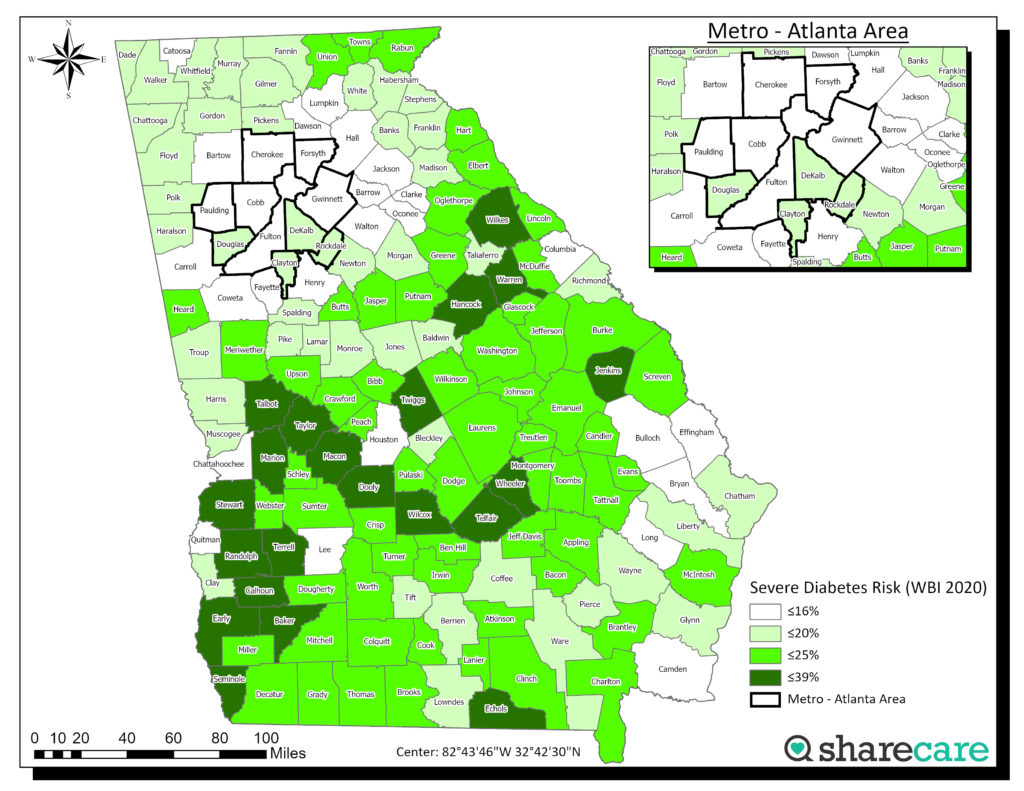
As seen in the Obesity Risk map above, counties located in Northern Georgia demonstrate the lowest risk for obesity, with broadly high levels of obesity risk spanning throughout the central, Western and Southern counties. For diabetes, we see broadly low levels of severe risk in Metro Atlanta, with the highest levels of severe risk concentrated in Georgia’s central and Western counties.
In contrast to the other maps, where Metro Atlanta demonstrates broadly lower health-related risks, we see high levels of severe stress risk for the Metro Atlanta area and the lowest levels spanning throughout central Georgia.
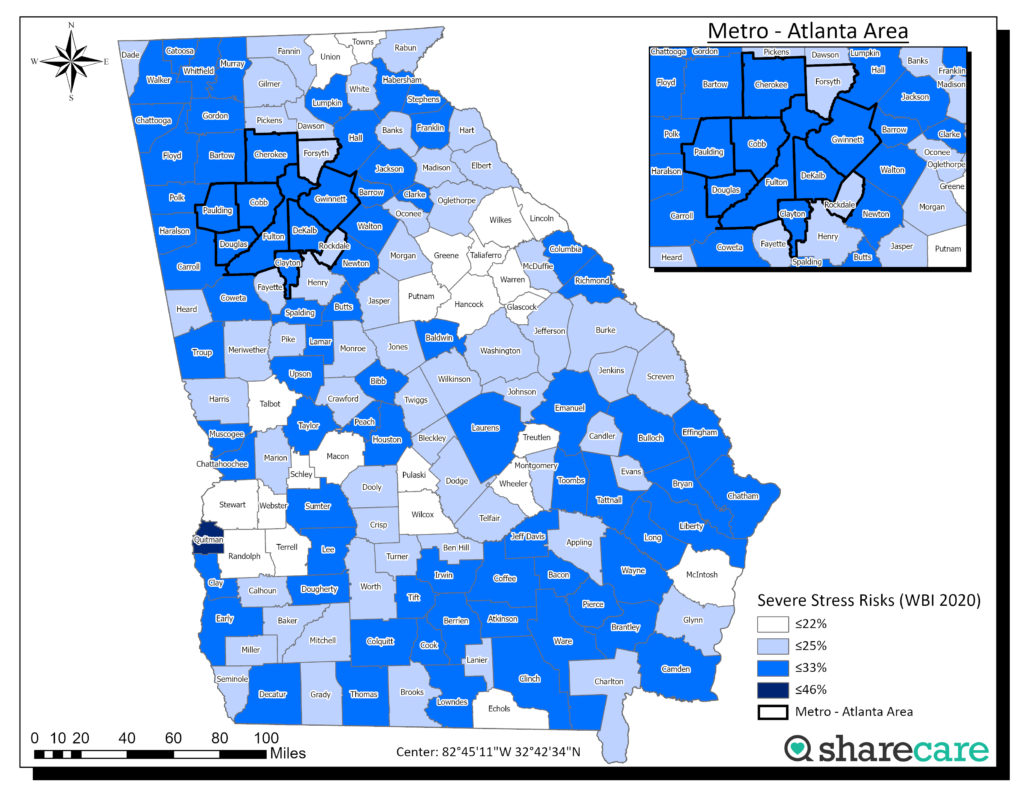
In all four maps, we see correlations between CWBI scores and well-being risks. Through collecting the same measures – well-being, condition burden, and social determinants data – we can target resources and interventions based on a custom analysis of unique community characteristics, health-related risks, and needs all tied to the distribution of scores.