Americans’ Life Outlook Best in Seven Years
Reposted with permission from Gallup
STORY HIGHLIGHTS
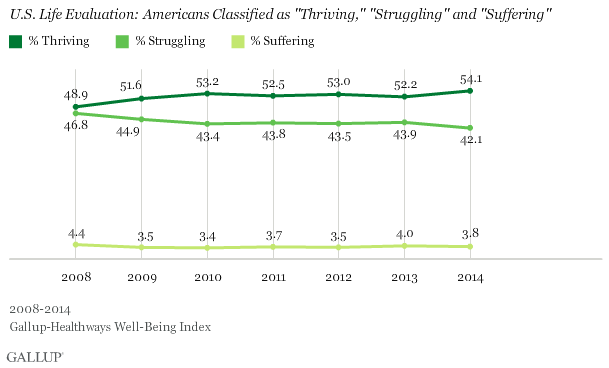
- 54.1% considered “thriving,” highest since tracking began in 2008
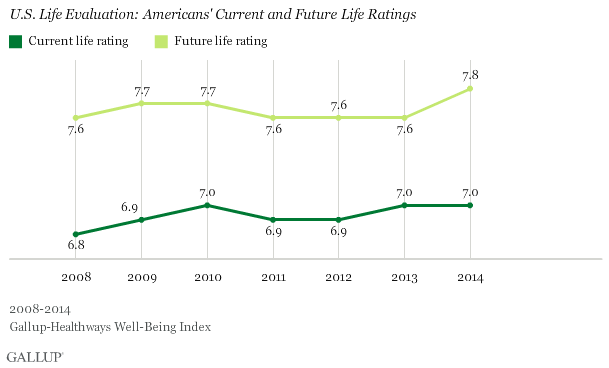
- Future life ratings improved from 2013; current life ratings did not
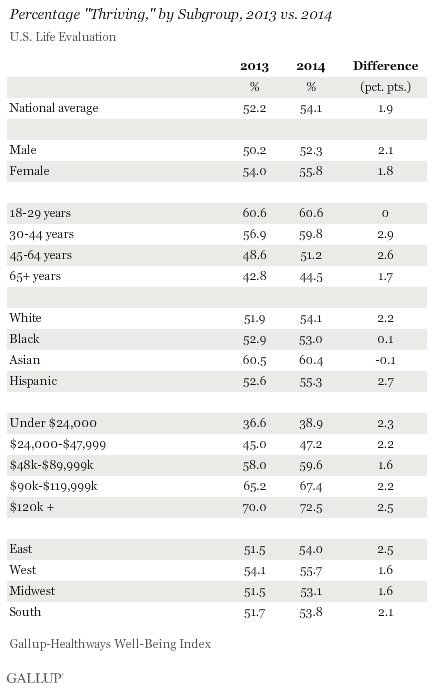
- Blacks’, Asians’ and young adults’ life ratings unchanged from 2013
WASHINGTON, D.C — Americans’ outlook on life is the best it has been in at least seven years. More Americans were “thriving” and fewer were “struggling” in 2014 than has been the case since Gallup and Sharecare began tracking Americans’ life evaluations daily in 2008. In 2014, 54.1% of Americans, on average, rated their lives highly enough to be considered thriving and 42.1% were classified as struggling.
Gallup and Sharecare measure Americans’ life evaluations as part of the Gallup-Sharecare Well-Being Index. Gallup classifies Americans as “thriving,” “struggling,” or “suffering” according to how they rate their current and future lives on a ladder scale with steps numbered from 0 to 10 based on the Cantril Self-Anchoring Striving Scale. Those who rate their present life a 7 or higher and their lives in five years an 8 or higher are classified as thriving, while those who rate both dimensions a 4 or lower are considered suffering. Respondents whose ratings fall in between are considered struggling.
The rise in Americans’ life ratings last year was driven by an improvement in how they evaluate their future lives, rather than their current situation. Americans, on average, rated their future lives a 7.8, up from 7.6 in 2013, which is the highest recorded score on this measure to date. On the other hand, Americans’ current life ratings averaged 7.0, unchanged from 2013 and similar to ratings found since 2009. As is typical, Americans’ future life ratings were higher than their current life ratings.
Blacks, Asians and Young Americans No More Likely to Be Thriving Than in 2013
A higher percentage of Americans in many key subgroups were thriving in life evaluations in 2014 compared with 2013. Middle-aged Americans, Hispanics, Eastern residents and those earning $120,000 or more annually saw their percentage thriving improve the most. Men’s ratings improved more than women’s, although women maintain an edge and are still ahead of men in their percent thriving, a pattern seen since 2008.
Importantly, the percentages of blacks, Asians and young Americans who were “thriving” in 2014 are unchanged from 2013, showing that life ratings are not improving across the board. However, because these groups had among the highest life ratings in 2013, they still compare favorably to other groups. The percentages of seniors and those Americans earning $48,000 to $90,000 annually who are thriving improved slightly, but trailed the improvement seen nationally.
Broadly speaking, the life evaluation metric is most strongly linked to income, followed by age. Higher-income Americans and young adults have consistently been more likely to be classified as thriving than their lower-income and older counterparts, the latter group mainly because of their lower projections for their future lives.
Bottom Line
Americans, on average, rated their lives in 2014 better than in any year since Gallup and Sharecare began tracking this metric in 2008, and this likely reflects increasing optimism about their future, finances and the U.S. economy. This uptick in thriving coincides with an increase in Americans’ ratings of their standard of living, a rise in their economic confidence at the end of 2014, and more Americans saying now is a good time to find a quality job.
Previous Gallup research shows that Americans’ life ratings tend to track closely with their standard of living perceptions and confidence in the national economy. Thus, if Americans’ perceptions of the economy and their personal finances continue to climb in 2015, their life ratings likely will rise as well.
SURVEY METHODS
Results are based on telephone interviews conducted Jan. 2-Dec. 30, 2014, as part of the Gallup-Sharecare Well-Being Index survey, with a random sample of 176,903 adults, aged 18 and older, living in all 50 U.S. states and the District of Columbia. For results based on the total sample of national adults, the margin of sampling error is ±1 percentage points at the 95% confidence level.
Each sample of national adults includes a minimum quota of 50% cellphone respondents and 50% landline respondents, with additional minimum quotas by time zone within region. Landline and cellular telephone numbers are selected using random-digit-dial methods.
Learn more about how the Gallup-Sharecare Well-Being Index works.


